RESEARCH ARTICLE
Food Web Analysis of Jordanelle Reservoir, Utah, USA: Where Do All the Rainbows Go?
Joshua A. Verde*, Mark C. Belk
Article Information

Identifiers and Pagination:
Year: 2018Volume: 11
First Page: 27
Last Page: 35
Publisher Id: TOFISHSJ-11-27
DOI: 10.2174/1874401X01811010027
Article History:
Received Date: 28/5/2017Revision Received Date: 11/07/2018
Acceptance Date: 24/07/2018
Electronic publication date: 29/08/2018
Collection year: 2018
open-access license: This is an open access article distributed under the terms of the Creative Commons Attribution 4.0 International Public License (CC-BY 4.0), a copy of which is available at: (https://creativecommons.org/licenses/by/4.0/legalcode). This license permits unrestricted use, distribution, and reproduction in any medium, provided the original author and source are credited.
Abstract
Background:
Reservoir communities in the intermountain west are typically dominated by a mix of introduced fishes. Due to the non-coevolved interactions present in these communities, energy flow and trophic interactions may not facilitate optimal growth and survival for all species. It is difficult to predict how well each species will survive in such novel communities. One such community is in Jordanelle Reservoir in northern Utah, USA. Recently, low survival and recruitment of stocked rainbow trout (Onchorhynchus mykiss) have been observed in Jordanelle Reservoir.
Objective:
We characterize the food web structure of the fish community in Jordanelle reservoir to infer competitive or predatory interactions that might lead to a poor return of stocked rainbow trout.
Methods:
We performed a stable isotope analysis on the fish community in Jordanelle Reservoir and carried out niche space analyses using the software package Stable Isotope Bayesian Ellipse (SIBER) in R.
Results:
Small rainbow trout exhibit high competitive overlap with brown trout (Salmo trutta), smallmouth bass (Micropterus dolomieu), and yellow perch (Perca flavescens). In addition, large brown trout and large smallmouth bass may feed heavily on small rainbow trout.
Conclusion:
Food web analysis suggests that rainbow trout encounter a highly competitive and potentially high predation environment in Jordanelle reservoir, leading to observed low return rates.
1. INTRODUCTION
Reservoirs in the intermountain west are typically dominated by a mix of non-native fish introduced from elsewhere in North America or Europe for angling purposes [1-5]. The novel interactions among fish in these reservoirs can cause the food web to function in non-coevolved and unpredictable ways [6, 7]. Often, food webs in reservoirs are less stable than food webs in natural lakes with intact native species compositions [8]. Many aquatic systems have size-structured interactions between species [9-11]. Ontogenetic niche shifts and mixed competition-predation interactions result in complex systems where a single species can fill several different niches depending on its life stage [12]. The evolutionary history of an introduced species interacts with local environmental and biotic conditions to increase potential complexities. These novel interactions can result in high levels of predation (top-down effects) or reduced amounts of energy flow up through the food web (bottom-up effects) [8, 13]. Given the complexity of aquatic ecosystems and the novelty of artificial reservoir communities, it is often difficult to determine what species combinations may lead to optimal growth and survival of target species.
In freshwater lentic systems, both top-down and bottom-up effects can influence the growth and population dynamics of fishes [14, 15]. Top-down effects are manifest as control of lower trophic levels by consumers and in freshwater systems, this is typically control of zooplankton or small fishes by larger predatory fishes [16, 17]. Bottom-up effects are manifest as control of higher trophic levels by producers, where nutrient availability typically determines the productivity of phytoplankton and thus exerts control on zooplankton and fish occupying the trophic levels above [18]. In natural systems, both top-down and bottom-up forces can act simultaneously on community structure and function and effects can potentially be interactive [19, 20].
Rainbow trout (Oncorhynchus mykiss) are a highly sought after game fish and, as such, have been widely stocked for recreational fishing [21]. Jordanelle Reservoir, in central Utah, has been continuously stocked with rainbow trout since the impoundment was completed in 1992 and is currently stocked annually with rainbow trout at an average size of 217 mm (2012-2015, Utah Division of Wildlife Resources stocking report). The catch per unit effort for rainbow trout in Jordanelle reservoir was initially high after the reservoir filled and then reached an equilibrium at lower catch rates [22], possibly due to reservoir aging [23]. However, in recent years, the catch rate for rainbow trout has dropped further and the cause of this is not known [22, 24]. Introduced sportfish comprise the majority of the fish community in Jordanelle, with brown trout (Salmo trutta), rainbow trout, and smallmouth bass (Micropterus dolomieu) attaining the largest body sizes. The presence of these three top-level predators in Jordanelle reservoir suggests that competition for prey with brown trout and smallmouth bass may be responsible for the poor return on stocked rainbow trout. Alternatively (or additionally), small rainbow trout may sustain high amounts of predation from larger brown trout, smallmouth bass, and even cannibalism from large rainbow trout. To illuminate the likely contributing factors, we can employ a characterization of the food web in Jordanelle reservoir to reveal the mixed competition-predation interactions and clarify why stocked rainbow trout exhibit poor returns in catch rates.
Stable isotope ratios of carbon and nitrogen have been used to characterize food webs and trophic niche because they integrate an organism’s diet into two simple, but informative variables [25]. Stable isotope ratios provide a time-integrated measure of an organism’s diet for a specific time-window [26]. The stable isotope ratio of nitrogen (δ15N) is used to estimate the trophic level of an organism because it is enriched from prey item to predator by roughly 3-4‰ (parts per thousand) [27-29]. The stable isotope ratio of carbon (δ13C) is indicative of the source of carbon fixation (i.e., source of energy) [29-33]. In a lake ecosystem, the δ13C is useful to differentiate between pelagic and littoral carbon sources. Carbon fixed in littoral environments is enriched in δ13C relative to carbon fixed in the pelagic energy pathway [34].
To explore the problem of low return on stocked rainbow trout in Jordanelle reservoir we used stable isotope analysis to quantify the food web structure and determine the trophic niche of rainbow trout. Our objective was to explore possible top-down or bottom-up factors that may lead to low survival of stocked rainbow trout.
2. MATERIALS AND METHODS
2.1. Study System
Jordanelle Reservoir is a manmade impoundment on the Provo River located in Wasatch County, Utah, USA. With the completion of Jordanelle dam in 1992, the reservoir began filling. The reservoir sits at an elevation of 1,880 m and has a surface area of 13.35 km2. The reservoir has been continuously stocked with fish since 1993 [35]. Native fish species in the reservoir are cutthroat trout (Oncorhynchus clarki), Utah chub (Gila atraria), and Utah sucker (Catostomus ardens). Non-native fish species in the reservoir are rainbow trout, brown trout, smallmouth bass, and yellow perch (Perca flavescens).
2.2. Sample Collection
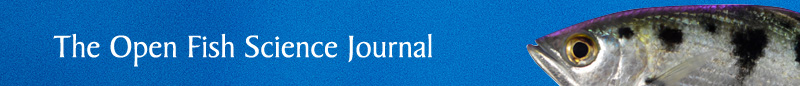
We sampled fish throughout the reservoir in spring and summer of 2015 using angling, gill nets and electrofishing (locations in Fig. 1); sample numbers in Table 1. We sampled with gill nets at 8 locations in the reservoir. Gill nets were set shortly before dusk and retrieved shortly after dawn to include two crepuscular periods. Using an electrofishing boat, we sampled 4 transects in the reservoir, with each transect sampled for 20 minutes. We removed a 1cm2 tissue sample from the epaxial muscle of each fish and recorded the total length of the fish. We used a 63µm plankton tow sampler to collect a sample from the water column and a sample from the water surface at three locations in the reservoir in June 2015 (locations in Fig. 1). We collected four samples of attached filamentous algae by hand near the shore in May 2015 (location in Fig. 1). We kept all samples frozen until lab preparation was commenced.
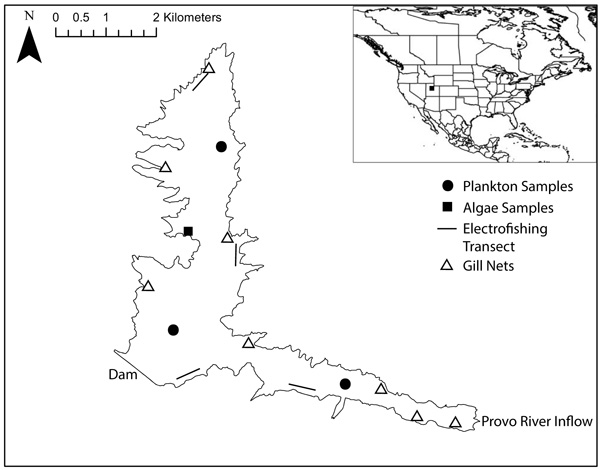 |
Fig. (1). Map of Jordanelle Reservoir, Utah, USA, showing dam, major inflow, and collection points for fish, plankton, and algae samples. |
2.3. Sample Preparation and Isotopic Analysis
We oven-dried tissue samples at 60° C for 72 hours, ground the samples into a homogeneous powder with a mortar and pestle, and measured 0.6 - 1.2mg of the powder into small tin capsules. We sent the capsules to the Colorado Plateau Stable Isotope Laboratory at Northern Arizona University in Flagstaff, Arizona for stable isotope analysis. The analysis was carried out on a Delta V Advantage Mass Spectrometer (Thermo Electron Corporation, Bremen, Germany) configured through a CONFLO III (Thermo Electron Corporation), using a Carlo Erba NC2100 Elemental Analyzer (Thermo-Quest Italia S.p.A., Milano, Italy). We used delta notation (δ13C and δ15N) expressed in parts per thousand (‰) for the stable isotope values. The ratio of the stable isotope in the sample is compared to the ratio in international standards (Vienna Pee Dee Belemnite for carbon and atmospheric nitrogen standard for nitrogen) by the following equation: δ13C or δ15N = [(Rsample/Rstandard) – 1] x 1000, where R is the ratio of 13C/12C or 15N/14N. We calculated the trophic level by using the following equation: Trophic position = [(δ15Nconsumer - δ15Nalgae)/2.9] + 1, where δ15Nconsumer is the average signature of the organisms in question, δ15Nalgae is the average signature for algae, 2.9 is the enrichment factor for one trophic level [36], and one is added to account for the trophic level of the algae.
To determine whether isotope signatures of fish species varied with length, we performed linear regressions between δ15N and total length and δ13C and total length for each species of fish (with the exception of Utah sucker, because all individuals of this species were large adults). For species that showed a significant relationship in the regression, we investigated further by splitting them into 100 mm size classes (e.g. 0-100 mm, 100-200 mm, 200-300 mm, etc.) and performing ANOVA analyses followed by a Tukey HSD on these size classes to find statistical differences to separate species into size groups. For analysis and graphical presentation, we separated species-size groups that showed significant differences in isotopic signatures (either in δ15N or δ13C) from other groups of the same species. Based on this analysis, we divided all species, except Utah sucker, into two size-based groups as follows. Rainbow trout and brown trout: small < 400 mm TL (total length), and large > 400 mm TL (we captured only three large rainbow trout); smallmouth bass and Utah chub: small < 200 mm TL, and large > 200 mm TL (we captured only one small Utah chub); yellow perch: small < 100 mm TL, and large > 100 mm TL.
2.4. Trophic Niche Analysis
To calculate the niche space occupied by each fish species and overlap with small rainbow trout, we used the program Stable Isotope Bayesian Ellipse in R (SIBER) [37]. This program uses a maximum likelihood function based on the variance and covariance of the stable isotope signatures to construct ellipses that encompass roughly 40% of each included species data points, which is intended to represent the core niche of a species. We then calculated the overlap of this core niche area between small rainbow trout and other species. We used the R statistics package to perform all statistical analyses [38].
| Species | n | δ13C | δ15N |
|---|---|---|---|
| brown trout (large, > 400 mm) | 12 | -28.14 + 0.97 | 14.47 + 0.44 |
| brown trout (small, < 400 mm) | 8 | -28.56 + 0.54 | 13.05 + 0.65 |
| rainbow trout (large, > 400 mm) | 3 | -30.84 + 0.75 | 15.69 + 0.62 |
| rainbow trout (small, < 400 mm) | 23 | -29.15 + 0.55 | 13.59 + 0.17 |
| Utah chub (large, > 200 mm) | 28 | -31.16 + 0.48 | 12.25 + 0.30 |
| Utah chub (small, < 200 mm) | 1 | -25.24 | 10.76 |
| Utah Sucker | 9 | -27.92 + 0.90 | 11.54 + 0.27 |
| smallmouth bass (large, > 200 mm) | 26 | -28.01 + 0.27 | 14.58 + 0.23 |
| smallmouth bass (small, < 200 mm) | 14 | -27.93 + 0.48 | 13.60 + 0.45 |
| yellow perch (large, > 100 mm) | 13 | -27.89 + 0.41 | 13.32 + 0.48 |
| yellow perch (small, < 100 mm) | 15 | -29.19 + 0.23 | 12.85 + 0.32 |
| algae | 4 | -26.99 + 0.30 | 6.09 + 1.00 |
| plankton | 5 | -32.19 + 0.59 | 6.79 + 0.85 |
3. RESULTS
3.1. Food Web Structure
As expected, trophic position varied widely among organisms in the food web Fig. (2). Algae was positioned at the base of the food web (trophic level 1), consistent with its place as primary producers. Plankton was near the base of the food web indicating a composition of plankton samples dominated by phytoplankton (trophic level 1.2). Utah sucker and Utah chub occupied the lowest trophic levels among the fish (2.8 to 3.1). Small brown trout and both size classes of yellow perch occupied the next trophic levels (3.3 to 3.4). Small rainbow trout, large brown trout, and smallmouth bass occupied slightly higher trophic levels (3.6 to 3.9). Large rainbow trout occupied the highest trophic level (trophic level 4.3).
Jordanelle reservoir exhibited littoral and pelagic energy pathways, and these two pathways converged somewhat at the level of top predators Fig. (2). The base of the littoral energy pathway was occupied by algae (enriched in δ13C). The base of the pelagic pathway was occupied by plankton (depleted in δ13C). Fish were positioned somewhat intermediate between the littoral and pelagic pathways. Utah sucker had the highest dependence (enriched in δ13C) on the littoral energy pathway among fish, followed by smallmouth bass, brown trout and yellow perch, respectively. Small rainbow trout exhibited a slightly higher dependence on the pelagic energy pathway, while Utah chub and large rainbow trout had the highest dependence on the pelagic energy pathway among fish (least enriched δ13C).
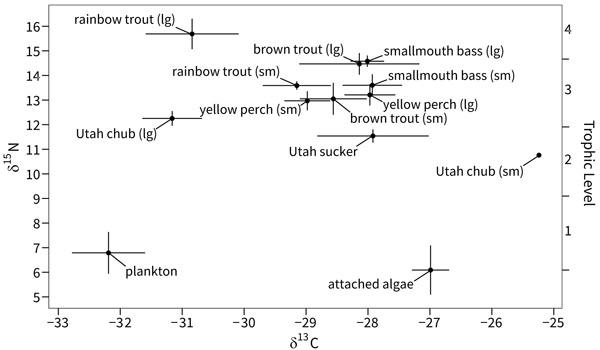 |
Fig. (2). Bi-plot of average δ13C and δ15N signatures of all fish species, algae, and plankton in Jordanelle Reservoir, Utah, USA. Error bars represent confidence intervals. |
3.2. Trophic Niche Analysis
The core isotopic niche of small rainbow trout overlapped substantially with four other species-size groups as follows: 38.4% with small yellow perch, 38.1% with small brown trout, 31.6% with small smallmouth bass, 25.6% with large yellow perch, and 2.5% with large brown trout. The core niche of small rainbow trout did not overlap with large rainbow trout, large smallmouth bass, or Utah chub (Fig. 3).
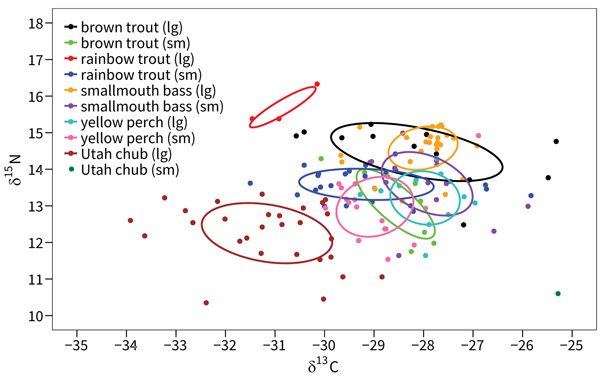 |
Fig. (3). Core isotopic niche ellipses and niche overlap from SIBER analysis for two size classes of five species of fish from Jordanelle Reservoir, Utah, USA. |
4. DISCUSSION
We show strong evidence for competition between small rainbow trout and other fish in Jordanelle reservoir. The core niche of small rainbow trout overlapped moderately with small size classes of brown trout and smallmouth bass and with both size classes of yellow perch. Overall, more than half of the core niche of small rainbow trout is overlapped by a combination of these fish. The niche space around the small rainbow trout appears to be crowded with brown trout, smallmouth bass, and yellow perch. The core niche of small rainbow trout was slightly more depleted in δ13C than the other fish with which it overlapped, suggesting a slightly higher dependence on pelagic food sources, which has been observed in other systems [39-41]. Competition with other fish species may account for the slightly more pelagic diet of small rainbow trout. Brown trout have displaced rainbow trout in other systems and smallmouth bass and yellow perch have impacted other salmonids by displacing them from the littoral energy pathway into the pelagic energy pathway [42-44]. However, in Jordanelle reservoir, Utah chub are the most abundant fish in the reservoir, and they may be monopolizing the pelagic energy sources (i.e., zooplankton) [24]. As such, small rainbow trout appear to be inhabiting a highly competitive environment between brown trout, smallmouth bass, and yellow perch in the littoral energy pathway and Utah chub in the pelagic energy pathway. High levels of competition with other species could contribute to the poor return of rainbow trout in this system.
Large brown trout and large smallmouth bass attain sizes in Jordanelle reservoir that allow them to prey upon the smaller size classes of rainbow trout, which could create a strong top-down effect. Hatchery-reared fish are often predator naïve and are highly susceptible to predation because they often lack antipredator responses [45]. In an attempt to reduce predation on newly stocked rainbow trout, the Utah Division of Wildlife Resources stocks rainbow trout at sizes larger than 200 mm. However, our samples included several brown trout over 500 mm and a few smallmouth basses over 350 mm, which would possess a gape size large enough to prey upon stocked rainbow trout [40, 46]. In addition, some rainbow trout exceeded 400 mm and were large enough to prey upon stocked rainbow trout. Furthermore, the position of large brown trout and large smallmouth bass in the food web suggests that these species likely prey heavily on small rainbow trout and other small fishes that have similar isotopic signatures as small rainbow trout (i.e., yellow perch, small brown trout, and small smallmouth bass). High levels of predation from large piscivores could contribute to the poor return of rainbow trout in this system.
The few rainbow trout that survive and grow to large size in Jordanelle reservoir appear to exhibit an ontogenetic niche shift at around 400 mm when they begin to feed at a higher trophic level that is also farther toward the pelagic energy pathway than small rainbow trout. Often, such shifts at larger body sizes coincide with a switch to piscivory [47], and these large individuals had the highest trophic signature of all fish sampled. The core niche of large rainbow trout did not overlap with any other species. However, this core niche is only based on three individuals and the size of the core niche is likely underestimated. Nevertheless, these fish were grouped tightly and distinctly from all other species in our sampling, suggesting a diet switch to an area of trophic niche space that is unoccupied by other fish in the reservoir.
CONCLUSION
We show evidence for the possibility of both bottom-up and top-down effects on rainbow trout in Jordanelle reservoir. Due to the dual nature of threats to small rainbow trout (i.e., competition and predation), it seems unlikely that stocking different species of sports fish would alleviate the problem of low survival of rainbow trout. Rainbow trout survival will probably remain low unless the composition of the food web changes dramatically to alleviate either competitive or predatory interactions indicated by this analysis.
ETHICS APPROVAL AND CONSENT TO PARTICIPATE
Not applicable.
HUMAN AND ANIMAL RIGHTS
Samples were collected under direction of the Utah Division of Wildlife Resources. All sampling was conducted in accordance with the American Fisheries Society Guidelines for the Use of Fishes in Research.
CONSENT FOR PUBLICATION
Not applicable.
CONFLICT OF INTEREST
The authors declare that they have no conflict of interest. This project was funded by the Utah Division of Wildlife Resources (UDWR).
ACKNOWLEDGEMENTS
All fish samples were collected under the direction of the Utah Division of Wildlife Resources. We would like to thank M. Slater, D. Wiley, and J. Watson from the UDWR for providing reports and assistance with collecting samples. Funding was provided by UDWR. We thank A. Brooksby, D. Shirley, S. Smith, W. Gleave, J. DeMordaunt, A. DeVries, A. Jensen, and D. Chambers who helped with the collection and processing of samples.