
RESEARCH ARTICLE
Have Invasive Mysids (Mysis diluviana) Altered the Capacity of Osoyoos Lake, British Columbia to Produce Sockeye Salmon (Oncorhynchus nerka)?
Kim D. Hyatt1, *, Donald J. McQueen2, Athena D. Ogden1
Article Information

Identifiers and Pagination:
Year: 2018Volume: 11
First Page: 1
Last Page: 26
Publisher Id: TOFISHSJ-11-1
DOI: 10.2174/1874401X01811010001
Article History:
Received Date: 20/2/2018Revision Received Date: 29/03/2018
Acceptance Date: 12/04/2018
Electronic publication date: 31/05/2018
Collection year: 2018
open-access license: This is an open access article distributed under the terms of the Creative Commons Attribution 4.0 International Public License (CC-BY 4.0), a copy of which is available at: (https://creativecommons.org/licenses/by/4.0/legalcode). This license permits unrestricted use, distribution, and reproduction in any medium, provided the original author and source are credited.
Abstract
Background:
During 2005-13, at Osoyoos Lake, British Columbia, we investigated trophic relationships among fry of Oncorhynchus nerka Walbaum (Sockeye and kokanee), a suite of limnetic planktivores including Mysis diluviana, and their zooplankton prey.
Objectives:
Our goal was to quantify the impacts that a recently introduced population of Mysis would have on density, growth and survival of resident age-0 Sockeye Salmon.
Methods:
Evidence of Mysis impact was based on (a) simple correlation analysis between various biophysical performance measures and (b) production and bioenergetics models used to identify the strength of bottom-up (i.e. production-driven) and top-down (i.e. consumption-driven) processes.
Results:
This nine-year study indicated that the Osoyoos Lake food web was strongly influenced by external events These included: large annual variations in river discharge, an earthen dam failure and effluent input from an Okanagan River tributary, and highly variable recruitment of O. nerka fry given out-of-basin factors (harvest, marine survival) controlling adult salmon returns. Surprisingly, large annual variations in O. nerka recruitment (0.63 - 7.0 million fry), did not induce significant “top-down” associations in growth, survival or subsequent production among the macro-planktivores (pelagic fish and Mysis) and their zooplankton prey. A single significant correlation (p ≤ 0.05) between O. nerka fry abundance and their von Bertalanffy W∞ parameter emerged from a set of 14 potential top-down associations tested. By contrast, we identified several strongly positive “bottom-up” effects in which survival of O. nerka fry was significantly associated (p ≤ 0.01) with annual variations in total zooplankton biomass, Daphnia biomass and Epischura biomass. Our results indicate that Mysis played a dual role in the Osoyoos Lake pelagic food web. As predators, they accounted for an average (June-October) of 64% of the total prey biomass consumed by fish and Mysis. As prey, Mysis contributed an average of 35% of the prey biomass consumed by fish. Consumption by fish and Mysis together accounted for daily losses of only 4.5% of non-mysid zooplankton biomass and 34% of daily zooplankton production.
Conclusion:
We conclude that in all years, combined prey consumption by Mysis and fish was never high enough, acting alone, to reduce the availability of their potential zooplankton forage base. However, we also estimate that in the absence of Mysis, O. nerka fry could experience a 43% increase in their daily food intake and that fish and Mysis might control their principal prey taxa when exogenous factors (e.g. annual discharge) induced major reductions in zooplankton biomass. Finally, although Mysis has clearly altered the energy flow pathways from plankton to fish in the Osoyoos Lake food-web, mysids have not precluded rebuilding O. nerka abundance to levels at or exceeding historic maxima.
1. INTRODUCTION
During the period 1964-94, average Sockeye Salmon (Oncorhynchus nerka) escapement into the Okanagan River and Osoyoos Lake fell from 50,000 to 20,000 adults, and during the period 1995-2004, escapement declined further to <5,000 for three years and <1500 during one year [1-3]. In response to these trends, the Okanagan Nation Alliance (ONA) and Colville Confederated Tribes, in conjunction with government agencies and Columbia River power producers, undertook several programs to investigate requirements for rebuilding the Okanagan River population of Sockeye Salmon. These included changes in harvest management of the Columbia River Sockeye fishery, restoration of side-channels and spawning sites in the Okanagan River, and development of a decision support system [4] to promote “fish-friendly” flows in the Okanagan River to eliminate egg losses due to redd-desiccation in winter and egg/alevin losses from redd-scour in spring. The plan was first to rebuild the wild-origin population of Okanagan Sockeye Salmon to historical levels (around 3,000 fall fry ha-1), and then, assuming nominal egg-to-fry rates of survival [5], to test the hypothesis that Osoyoos Lake might have the capacity to support fall fry densities of >9,000 ha-1 while still maintaining smolt sizes of no less than 6 g at seaward migration [2].
However, a potential problem with these optimistic stock rebuilding projections was that preliminary surveys of Osoyoos Lake revealed that sometime during the 1990s Mysis diluviana (previously Mysis relicta [6]) had moved downstream from their initial site of introduction in Lake Okanagan [7] into Osoyoos Lake (Figure 1, inset). Because juvenile Sockeye, juvenile kokanee, and mysids all consume similar zooplankton prey, and because mysid introductions have been widely associated with collapses of pelagic fish populations [8], it seemed likely that rebuilding O. nerka stocks even to historic abundance levels might prove to be impossible.
Preferred prey for juvenile Sockeye Salmon and kokanee (both O. nerka and hereafter referred to as nerkids) include large-bodied zooplankton such as Daphnia and Epischura [9-14], medium-sized species such as Bosmina, Diaphanosoma, Holopedium [15-16], and both cyclopoid and calanoid copepods [17-19]. Diets for M. diluviana include many of these same prey, and Mysis rates of predation are high enough that in other lakes they have been associated with the reduction or elimination of several cladoceran species [20-28].
In addition to the complexities associated with a high degree of prey overlap, the invasion of Mysis into Osoyoos Lake created a more complex food-web characterized by Intra-Guild Predation (IGP) [29]. In this new configuration (trophic triangle [30]), both age-0 nerkids and Mysis were expected to consume zooplankton, and the potential existed for nerkids of various ages to consume Mysis.
Previous studies of Mysis invasions [8, 31, 32] have concluded that in most cases when Mysis invade kokanee lakes, kokanee populations decline. Lake Tahoe was stocked with Mysis during the mid-1960s and the result was the loss of Daphnia pulicaria, Daphnia rosea, and Bosmina longirostris [23, 33]. This loss was associated with changes in fish diets and reductions in kokanee productivity relative to their historic stock-recruitment relationships. Flathead Lake was stocked with Mysis in the mid-1980s, and the result was the elimination of Daphnia longiremis and Leptodora kindtii and delays in the spring population increase of D. thorata [34]. These changes were associated with declining kokanee populations [35, 36]. In Lake Pend Oreille (Idaho), Chipps and Bennett [37] found that consumption of cladocerans by M. diluviana was about four times greater than consumption by all kokanee age classes together, and they suggested that the presence of Mysis may have been associated with a substantial decline in kokanee numbers. Earlier studies in Lake Pend Oreille had linked these declines to Mysis-induced reductions in the number of days per year that Daphnia were found in the water column [25]. Additional studies indicated that kokanee and Mysis consumed 56% and 42% respectively of Lake Pend Oreille zooplankton production [38]. Further, during isothermal conditions, Mysis consumed 100% of cladoceran production and likely contributed to spring suppression of juvenile kokanee growth and survival [39]. All of this work implies that Mysis invasions have negative impacts on kokanee populations.
However, other studies suggest that the presence of Mysis may have less severe impacts on zooplankton availability as prey for nerkids. In Kalamalka and Okanagan lakes, Whall and Lasenby [40] estimated that Mysis consumed about 1% of zooplankton biomass d-1. In Kootenay Lake, Mysis consumed 2-4% of zooplankton biomass d-1 [41, 42]. In Muriel Lake, Neomysis mercedis could consume up to ten times more zooplankton per day than did juvenile Sockeye [43, 44], but Muriel Lake Sockeye fry also consumed Neomysis, and Hyatt et al. [15] found that during high Sockeye Salmon fry recruitment events due to exogenous factors, Neomysis population biomass could be significantly reduced by Sockeye fry predation.
The question for Osoyoos Lake was whether the presence of Mysis diluviana, as a relatively recent invasive species, might enhance food availability for juvenile nerkids or whether competition from Mysis would reduce zooplankton biomass, reduce the critical carrying capacity of the lake to support pelagic fish, and thus constrain attempts to rebuild production of Sockeye Salmon back to their historic abundance.
2. SITE DESCRIPTION AND METHODS RESEARCH PROTOCOL
We addressed this research question over nine years (2005-13) using two approaches. (1) For the period 2005-13, we used yearly averages to generate simple correlations between various performance measures including: total and taxon-specific zooplankton biomass, Mysis biomass, fish density, fish biomass, and age-0 nerkid growth and survival. (2) For 2009-13, we used production and bioenergetics models to generate dynamic measures of zooplankton production that could be compared with total and taxon-specific measures of prey consumption by limnetic fish including age-0 nerkids.
Our research protocol included six steps. (i) To detect potential changes in Osoyoos Lake physical-chemical conditions, we monitored (May-October) oxygen concentrations, temperature, water chemistry, taxonomic composition and biomass of phytoplankton, and rates of water turnover. (ii) To detect potential changes in prey availability, we estimated density, biomass, length-weight relationships and production for all of the limnetic prey (i.e. crustacean zooplankton and Mysis) consumed by Mysis and age-0 nerkids. (iii) To quantify changes in the populations of limnetic predators, we estimated age-specific growth, production and survival for five groups of limnetic fish (age-0 wild nerkids, age-1 nerkids, age-0 stocked Sockeye, summed age-2 and -3 kokanee, and Lake Whitefish, Coregonus clupeaformis) and for the macroinvertebrate planktivore Mysis diluviana. (iv) To estimate rates of consumption of each taxon of zooplankton by M. diluviana and each group of fish, we used bioenergetics analysis [45, 46]. (v) We then compared the production (and changes in standing stock) of each zooplankton taxon with rates of consumption by the five groups of fish and Mysis. (vi) Finally, we assumed that if zooplankton consumption by fish and mysids exceeded zooplankton production, then standing crop losses of zooplankton as prey, and density-dependent suppression of juvenile Sockeye smolt production, would confirm that lake carrying capacity had been reached or exceeded.
Over the nine-year study period, we amassed about 14,000 year-by-year, sample-by-sample data records. These data are available online as a Fisheries and Oceans Canada Data Report [47].
2.1. Site Description and Fish History
All study observations were restricted to the north basin of Osoyoos Lake (Fig. 1), which is the only basin that meets depth, temperature and oxygen requirements of summer habitat for Sockeye fry [2]. North basin physical measures are: 7.5 km length, 990 ha surface area, 933 ha of usable limnetic fish habitat, 0.25 km3 volume, 63 m maximum depth, 21 m mean depth, with average water residence time measured in weeks.
One hundred years ago, more than eight Sockeye Salmon (Oncorhynchus nerka) populations spawned in the Columbia River watershed [48], but now only two self-sustaining populations remain. The largest of these migrates up the Columbia and Okanagan rivers and arrives at Osoyoos Lake during June-September ([49]; [1], as reviewed in [2]). Adult Sockeye Salmon hold in Osoyoos Lake until mid-September, after which they move north into the Okanagan River to spawn in October [3]. During April-May, newly hatched Sockeye fry move downstream to Osoyoos Lake, rear for one summer, overwinter, and leave as age 1+ smolts in spring (April-May). A small proportion of the Sockeye fry spends two years in the lake.
In the early 1970s, the Osoyoos Lake fish community was comprised of 20 species [50]. By 2004, the total had increased to approximately 28 species including several species of bass (Micropterus spp.), bullheads (Ictalurus spp.), suckers (Catostomus spp.), chub (Mylocheilus sp.), perch (Perca sp.), dace (Rhinichthys spp.), sculpins (Cottus spp.), and carp (Cyprinus sp.) [51]. Anadromous salmonids include Chinook Salmon (O. tshawytscha), Steelhead Trout (O. mykiss), and Sockeye Salmon (O. nerka). However, wild-origin Sockeye are orders of magnitude more common than the other salmonid species and occupy limnetic waters along with small numbers (<1% of the total) of kokanee (O. nerka) that complete their entire life cycle in freshwater. In addition to these resident fish, relatively small numbers of hatchery-origin Sockeye were either experimentally introduced to rear in Osoyoos Lake during 2010, 2012 and 2013, or alternatively passed through Osoyoos Lake in larger numbers during their spring seaward migration from Skaha Lake upstream (Fig. 1). However, all hatchery-origin fish were thermally marked and on average accounted for less than 8% (range 0.0-12.1%) of all nerkids present in Osoyoos Lake.
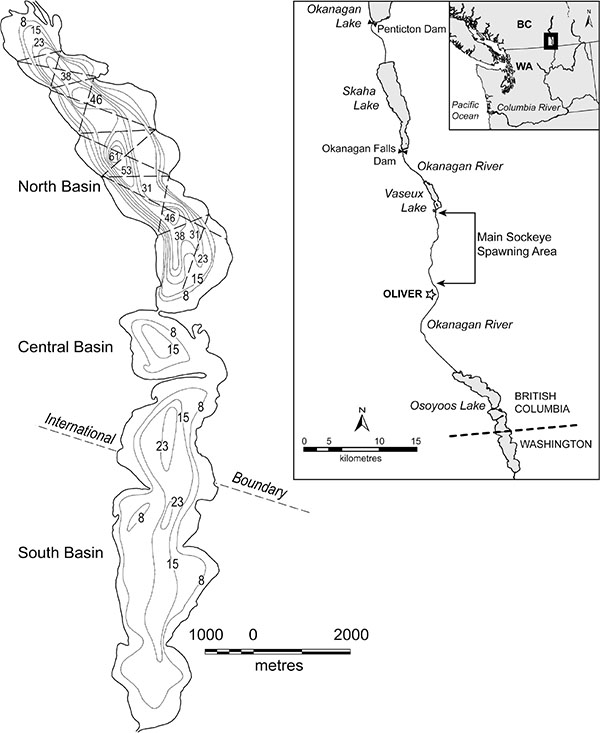 |
Fig. (1). Osoyoos Lake north basin, showing echosounding transects and lake bathymetry (water depths in m). Phytoplankton and water chemistry were sampled at 2 stations in 46 meters of water. Zooplankton were sampled at 5 stations all deeper than 30 m and equally spaced down the long axis of the lake. Mysis were sampled at 10 stations all deeper than 30 m and equally spaced down the long axis of the lake ([47] for details). |
2.2. Methods Summary
River flow was measured at Oliver, British Columbia, located 10 km north of Osoyoos Lake (Fig. 1). Oxygen and temperature (1 m depth intervals) were sampled at one to three week intervals at two stations equidistant along the long axis of the north basin. Water chemistry was sampled monthly (May-October) (1, 5, 10 m integrated samples and 20-45 m integrated).
Phytoplankton were sampled monthly (May-October) (1, 5, 10 m integrated samples). Phytoplankton taxa were identified to genus and many to species. Densities, cell sizes, cell shapes, and bio-volumes were recorded [47].
Zooplankton were sampled at five stations equidistant along the long axis of the north basin by means of a vertical haul net (0-30 m night-time hauls, 100 µm mesh, 0.5 m net diameter, net length 3 m, Rigosha flow-metered). Samples were collected at night every two to three weeks. At the laboratory, the five samples were used to produce one volume-weighted, combined sample for each sampling date. All zooplankton were identified to species, measured, and their eggs counted. Length-weight regressions were used to calculate dry weight biomass for each individual. Cladocerans and copepods (nauplii, copepodids, and adults) were identified to species. Details are provided in [47]. Species-specific production of zooplankton was principally calculated using the egg-ratio method for species that did not broadcast their eggs [52-54].
Throughout, our primary focus has been on zooplankton production estimates derived using the egg-ratio method, but for comparison, we have also used two additional methods to estimate rates of production for Epischura, Diacyclops, and Leptodiaptomus. The first of these is the well-known increment summation method, which sums the growth increments in biomass during a cohort’s lifespan. The version we used was developed by Cusson et al. [55] and is described as their method “IS-3.” The second is the size-frequency method [56], which sums the loss of biomass between successive size classes and weights them by the number of days between surveys. The method requires estimates of the Cohort Production Interval (CPI) determined on the basis of length distributions by survey date (Epischura: 1 year, Diacyclops: 9 months, Leptodiaptomus: 6 months).
Production estimates derived from size-frequency methods have been shown to be both higher and lower than estimates based on other methods. Waters and Crawford [57] found that the size-frequency method used to estimate mayfly production produced results that were 15 - 26% higher than other methods, including the removal summation method (which generates results equivalent to increment summation). On the other hand, simulation studies using “asynchronous” cohorts, i.e. not born all on the same day (as is true of the species examined here), have shown the size-frequency method to be biased low [55, 58].
Mysis diluviana were sampled at night every three to six weeks at ten stations by means of a vertical haul net (0-30 m nighttime hauls, 300 µm mesh, 1.0 m net diameter, net length 3 m, Rigosha metered). Each specimen was measured for total length, sex, and developmental stage. Mysis weight was calculated using the relationship of Johannsson [59]. Embryos from gravid females were counted. Production and consumption (June-October) were calculated using the bioenergetics model of Rudstam [46] adapted by Hanson et al. [60]. Model inputs included: mysid density, diet, mean weight at age, and daily water temperature. Each year the two mysid cohorts (reproducing adults and their offspring) were modelled separately to account for differences in weights, densities and mortalities. Model outputs were population biomass and production, and the biomass of zooplankton consumed by the various planktivores. Energy density for Mysis was fixed at 3400 joules g-1 wet weight, and energy densities for zooplankton as prey were set at 2500 and 3000 joules g-1 wet weight for cladocerans and copepods respectively [60]. For comparison, production was also estimated for Mysis using size frequency (CPI=14 months) and increment summation methods, without separation into cohorts.
Mysid diets were assessed from direct inspection of gut contents of juveniles (2-10 mm length) and adults (11-22 mm). During 2009-13, more than 2500 specimens (100 per sampling period) were examined for stomach contents. Mean weights for each prey type were taken from zooplankton field samples collected at the same time as the Mysis. Proportions of the various prey species consumed were based on average biomasses of each prey species identified in monthly gut samples of predators. Mysis diets were variable and included not only the prey that we found in the Mysis guts (Daphnia, Bosmina, Diaphanosoma, rotifers, Diacyclops and Leptodiaptomus), but also prey that were difficult or impossible to detect using gut analysis. These included nauplii, soft-bodied rotifers, and diatoms (reviewed in [39]). Based on stable isotope analysis (McQueen, unpublished observations) conducted in Skaha Lake (50 km north of Osoyoos Lake and containing exactly the same species assemblage), we concluded that consumption by Mysis should be reduced by 8% to account for the undetected presence of algae. Because we made no adjustment for nauplii and soft-bodied rotifers that may have been in Mysis diets, our consumption rate estimates for large prey may be higher than they should be. However, because both groups are relatively small-bodied compared to large species such as Daphnia, we expect that the estimation error attributable to the exclusion of these small-bodied prey is minimal.
Assessments of fish species composition, densities, ages, biomasses and diets were based on combined data from midwater trawls [61] and echosounding [62-65], with details given in [47].
Trawl-caught samples of fish were obtained at night, five to seven times per year [47]. Stomach contents were removed from approximately 30 - 60 age-0 nerkids and from all larger nerkids. Scales were removed and placed in a scale book, and otoliths were removed and placed in dry vials for later age determinations in the laboratory. Comparison of observations from gillnet versus trawl catches (Hyatt et al. unpublished data) indicates that larger nerkids and Lake Whitefish were able to evade the trawl net [66], which limited our ability to gather large samples for stomach analysis from the large (>15 cm) but relatively rare fish.
Acoustic surveys for fish abundance were conducted on five dates during 2005 using a Simrad EY-500 echosounder and on 5-7 dates during 2006-13 using a Biosonics DT-X echosounder. Fish density estimates were derived from both echo-integration analysis and trawl samples. Total fish densities were estimated from acoustics target analysis. Fish size-frequency distributions, based on acoustic signal strength, were estimated using Sonar5-Pro software (details in [47]).
From the combined trawl and acoustic data we identified five groups of pelagic fish. (i) Age-0 wild nerkids included wild Sockeye plus a small proportion (<1%) of wild kokanee. Kokanee proportions were back-calculated from annual counts of the relative abundance of Sockeye and kokanee in spawning areas the previous fall. Peak spawner counts in the Okanagan River (2005-13) showed that on average 2.3% of the spawners were kokanee (M. Stockwell, DFO unpublished data). The average egg count for Sockeye was 2463 eggs per female, and for kokanee about 350 per female. Given an assumption of equivalent egg-to-fry survival, <0.5% of nerkid progeny should have been kokanee fry. (ii) Relatively small numbers of hatchery-reared fish, originating from Osoyoos Lake Sockeye brood stock, were introduced into that lake during 2010, 2012, and 2013 [67]. These were identified from unique, thermally induced otolith marks. (iii) Age-1 nerkids included both wild age-1 Sockeye holdovers, resident in Osoyoos Lake, plus others, briefly passing through as smolts derived from upstream introductions of hatchery-origin Sockeye fry in Skaha Lake. (iv) Age 2-3 nerkids were identified from scale samples and assumed to be resident Osoyoos Lake kokanee. (v) Other fish >33 cm were also present according to acoustic signal estimates. Trawl and gillnet catches during the summer indicated that they comprised a mix of Lake Whitefish and returning adult Sockeye. During the fall, all adult Sockeye spawn in the Okanagan River, at which time most of the large in-lake, acoustic targets were Lake Whitefish. In Skaha Lake, a few kilometers upstream of Osoyoos Lake, we used gillnets to identify fish >33 cm, and found that 93% were Lake Whitefish.
For each year, fish bioenergetics models (the Sockeye model of [60]) were used to estimate prey-species specific rates of consumption by each of the four groups of nerkids (age-0 wild nerkids, age-0 stocked Sockeye, age-1 nerkids, and summed age 2+3 kokanee) plus Lake Whitefish (the Coregonid model of [60]). Model inputs included: density, diet and mean weight at age and daily water temperature. Model outputs were population density and biomass, and daily species-specific rates of zooplankton consumption by the various planktivores. Energy density for Lake Whitefish was set at 3952 joules g-1 wet weight and for the nerkids we used Equation 2 with Alpha1 = 5233 [60]. Energy densities for zooplankton as prey were set at 2500 and 3000 joules g-1 wet weight for cladocerans and copepods respectively, 3400 joules g-1 wet weight for Mysis, and 2000 joules g-1 wet weight for chironomids.
Density estimates based on samples collected from a single lake over a period of time (i.e. time series) raise pseudoreplication issues around the calculation of confidence intervals [68, 69]. To avoid this problem we used two density estimates per lake-year to characterize annual to seasonal changes in O. nerka abundance for bioenergetics modelling purposes. The July-November estimate was based on the average of all samples (usually n = 4) collected after full recruitment of fry to the limnetic zone was certain to have occurred. The pre-smolt density estimate was based on the average of all samples collected from October through winter (usually n = 3), after which both spring recruitment and spring-summer mortality outcomes are complete. We chose overlapping time periods because the July to November estimate is useful for assessments of the impacts of the fish on their zooplankton prey over the summer production interval, and the October to winter average of juvenile Sockeye density is our most reliable index of annual production of smolts destined to migrate seaward at age-1 in May-June after a single summer and winter of lake residence. Throughout, we provide two standardized survival estimates: (1) egg-to-fall fry (average July-November) and (2) egg-to-pre-smolt (average October-winter). The number of eggs was estimated using the annual average egg count multiplied by the number of Sockeye females estimated to be present annually on the spawning grounds [70].
2.3. Statistical Analysis
To identify the degree of similarity between diets of Mysis versus fish, we used Horn’s index of niche overlap or similarity [71]. The 95% confidence limits on the index were estimated from 10,000 bootstrapped replicates, as recommended for non-count data [72].
We fit our age-0 nerkid growth data using the von Bertalanffy growth curve [73], adjusted for weight, i.e.Wt =
 where: Wt is the weight (in g) at age t, W∞ is the asymptotic or maximum weight, K is the Brody growth coefficient, and t0 is the hypothetical age at which the stock has zero weight [74]. The age (t) used for the von Bertalanffy curves was the day of the year on which sampling occurred, with January 1 being day 1, and samples of the same cohort early in the next calendar year beginning on day 366. The von Bertalanffy parameters were obtained by minimizing the sums of squares, using the optimization function in base R [75]. Starting values for the optimizations were obtained from linear regression parameters generated by a linearization of the von Bertalanffy function [76].
For time series of total phytoplankton and zooplankton biomass and cumulative inflow from the Okanagan River, we scaled the data to have a mean of zero and standard deviation of 1. Two-tailed Durbin-Watson tests showed that the time series for phytoplankton, zooplankton and river flow were autocorrelated. We adjusted them using the first-differencing method,
 where
where
 is the adjusted first-differenced time series [77]. Pyper and Peterman [78] suggest that first differencing is most appropriate when relatively high autocorrelation values are present; they assessed the method for 15 to 50 years of data, whereas here we have n = 8 (n - 1 because of first-differencing). To evaluate the degree of autocorrelation that was present (i.e. this is relevant to the appropriateness of using the first-differencing method), we assumed a first-order autoregressive model, Xt =ϕXt-1 +εt, where ϕ was the autoregressive parameter, and εt was the normally distributed error term [79]. After these adjustments, we obtained revised correlation one-tailed p-values.
The other relevant time series were also tested for auto-correlation, and the first-differencing method was used where autocorrelation was detected. We estimated and reported correlations in the time series both with and without correcting for serial autocorrelation, although there is arguably little causal association from one year to the next for the population parameters of phytoplankton and juvenile salmon.
Because both phytoplankton and zooplankton were individually correlated with cumulative river inflow to Osoyoos Lake, we evaluated the correlation between standardized time series for phytoplankton and zooplankton. These new time series were without flow as a confounding variable. Specifically, total annual (May-October) phytoplankton and zooplankton biomass were each regressed against the annual cumulative flows for those months. The resulting residuals, with the effect of flow thus removed, were used as the revised phytoplankton and zooplankton time series. A new correlation, free of the effects of flow, was then calculated to assess the direct relationship between phytoplankton and zooplankton.
 |
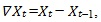
Fig. (2). Average (May-October) phytoplankton biomass recorded as mm3m-3 (which approximates µg L-1 wet weight). |
3. RESULTS
3.1. Phytoplankton and Zooplankton
In all years the dominant divisions of phytoplankton estimated as proportions by average weight in Osoyoos Lake included blue-green algae (Cyanophyta) at 39%, diatoms (Bacillariophyta) at 31%, green algae (Chlorophyta) at 11%, Chyrsophyta at 10%, and Cryptophyta at 6%. Based on size and toxicity, a nine-year average of 28% of the total phytoplankton volume was edible by zooplankton [80, 81] (details in [47]; (Fig. 2). Through the 2005-13 study period, total phytoplankton bio-volumes tended to be higher during the middle years (2007-10) than they were in 2005-06 or 2011-13.
In all years (2005-13) the Osoyoos Lake zooplankton community included three copepods: Diacyclops thomasi, Leptodiaptomus ashlandi and Epischura nevadensis, and four common cladocerans: Daphnia thorata, Bosmina longirostris, Leptodora kindtii, Diaphanosoma leuchtenbergianum (Fig. 3). In addition, there are rare occurrences of Ceriodaphnia sp., Daphnia pulex and Daphnia retrocurva. In all years, more than three -quarters of the total zooplankton biomass was comprised of nauplii, copepodites and adult copepods. The copepods D. thomasi and L. ashlandi were about equally abundant, and E. nevadensis was relatively rare. All of the cladocerans had low abundances, and within this group the order of abundance was D. thorata > D. leuchtenbergianum > B.longirostris. In terms of density, D. thomasi and L. ashlandi comprised more than 90% of the zooplankton that were large enough to be consumed by fish. The two zooplankton species most important to fish (i.e. Daphnia and Epischura), were relatively rare. Through the study period, total zooplankton biomasses tended to be higher during the middle years (2006-10) than they were at the beginning (2005) or near the end (2011-13).
We used the egg-ratio method to calculate production rates of five zooplankton species (Daphnia, Diaphanosoma, Bosmina, Diacyclops and Leptodiaptomus) that were most likely to be consumed by either fish or Mysis (Table 1). This list did not include Epischura, which are known to broadcast their eggs without carrying them in sacs or pouches [82], or Leptodora, which were never found with eggs intact. However, production was calculated for Epischura using both the size-frequency and increment summation methods; the former tended to produce slightly higher estimates. For comparison we also used the size-frequency and increment summation methods to estimate production for Diacyclops and Leptodiaptomus. For Diacyclops, we found that production estimates based on the size-frequency method were the highest, with the egg-ratio and increment-summation estimates being lower and quite similar in magnitude. For Leptodiaptomus, we also found that production based on the size-frequency method was highest, followed by estimates based on the egg-ratio method. The increment-summation methods consistently produced the lowest estimates for Leptodiaptomus (Table 1).
| Year | Nauplii and rotifers | Diacyclops | Leptodiaptomus | Epischura | Bosmina | Daphnia | Diaphanosoma | Leptodora | Total | Chironomid |
|---|---|---|---|---|---|---|---|---|---|---|
| 2005 | 3.1 | 16.9 (0.86) | 56.2 (2.46) | 5.3 | 1.6 (0.04) | 11.0 (0.59) | 6.0 (0.81) | 0.9 | 101 | nd |
| 2006 | 3.8 | 34.4 (1.04) | 53.2 (2.11) | 5.2 | 0.5 (0.03) | 6.7 (0.35) | 4.0 (0.27) | 0.47 | 108 | nd |
| - | - | (1.98, 0.67) | (3.16, 0.29) | (0, 0.01) | - | - | - | - | - | - |
| 2007 | 4.2 | 44.5 (0.75) | 52.3 (2.60) | 8.1 | 2.1 (0.17) | 20.3 (1.47) | 7.0 (0.81) | 4.66 | 143 | nd |
| - | - | (1.77, 0.53) | (3.91, 1.02) | (0.1, 0.04) | - | - | - | - | - | - |
| 2008 | 6.8 | 54.0 (1.36) | 48.3 (2.38) | 3.3 | 1.1 (0.07) | 13.9 (1.08) | 6.0 (1.24) | 2.09 | 135 | nd |
| - | - | (2.27, 0.89) | (4.77, 0.94) | (0.04, 0.01) | - | - | - | - | - | - |
| 2009 | 13.5 | 62.5 (1.40) | 54.1 (1.86) | 4.3 | 2.0 (0.20) | 21.03 (1.50) | 4.5 (0.94) | 1.62 | 164 | 0.2 |
| - | - | (9.77, 6.59) | (10.74, 4.29) | (0.07, 0.01) | - | - | - | - | - | - |
| 2010 | 4.6 | 68.7 (1.66) | 5.7 (1.08) | 1.9 | 2.4 (0.26) | 12.5 (1.45) | 2.3 (1.14) | 1.96 | 100 | 0.2 |
| - | - | (2.9, 1.41) | (0.5, 0.09) | (0.03, 0.02) | - | - | - | - | - | - |
| 2011 | 5.7 | 23.7 (1.60) | 30.5 (3.16) | 1.6 | 0.7 (0.08) | 3.7 (0.39) | 2.3 (0.98) | 0.98 | 69 | 0.4 |
| - | - | (2.27, 1.35) | (3.07, 1.71) | (0.04, 0.01) | - | - | - | - | - | - |
| 2012 | 5.4 | 25.3 (1.06) | 32.5 (2.54) | 2.6 | 1.6 (0.12) | 4.5 (0.97) | 3.3 (0.89) | 0.91 | 76 | 0.2 |
| - | - | (1.69, 0.62) | (3.42, 0.27) | (0.05, 0.04) | - | - | - | - | - | - |
| 2013 | 4.5 | 19.2 (1.09) | 19.5 (1.76) | 4.6 | 1.0 (0.18) | 3.7 (0.46) | 4.1 (1.20) | 0.14 | 57 | 0.2 |
| - | - | (1.36, 0.55) | (2.72, 0.26) | (0.09, 0.03) | - | - | - | - | - | - |
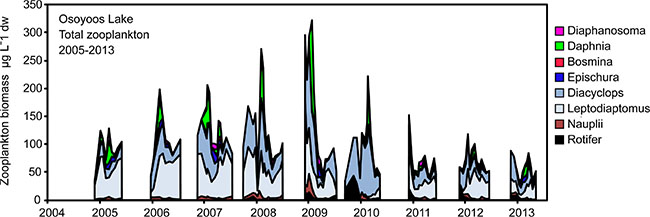 |
Fig. (3). Years 2005-13 Osoyoos Lake zooplankton biomass (µg L-1 dry weight). |
3.2. Mysis Diluviana
During 2005-13, Osoyoos Lake Mysis diluviana had a univoltine life cycle (Fig. 4). During each year, embryos first appeared in December-January, and their production lasted 4-6 months, ending during March-May. Juveniles and immature males and females developed through the spring-summer (March-October). Reproducing adults appeared in the late fall, began to reproduce during December-January, and in some cases, survived through to June. From start to finish, cohort members are found in the water column for about 16 months, but the life-span of individuals is likely shorter, ranging from 12-16 months. Mysis egg production from the 2010 cohort was the lowest ever observed, and during 2011, the population biomass was the lowest recorded. During 2012-13, densities and biomasses returned to normal (2012) or above normal (2013) levels.
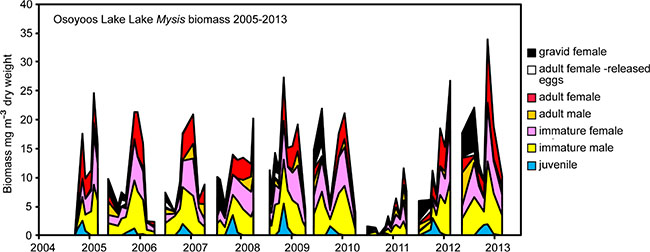 |
Fig. (4). 2005-13 Osoyoos Lake Mysis biomass (µg L-3 dry weight). |
Mysis production was estimated using three methods (Table 3). We found that production estimates based on the size frequency method were the highest, followed by the estimates based on the increment summation method. The estimates based on the output from the bioenergetics model were the lowest.
3.3. Correlations among Phytoplankton, Zooplankton and Mysis: Influence of River Discharge
During 2005-13, there appeared to be a significant “bottom-up” correlation between mean annual (May-October) estimates for phytoplankton and zooplankton (data Z-scored, Pearson r = 0.83, p = 0.003). However during the same time period, there were two distinctly different patterns of river discharge into Osoyoos Lake (Fig. 5). For the first six years of the study (2005-10), the average volume of water discharged into the Okanagan River (recorded at Oliver, British Columbia) between May and October totalled 0.28 km3. For the last three years (2011-13), the average volume of water discharged into the Okanagan River totalled 0.64 km3. These differences appeared to have significant influences on the biomass of phytoplankton and zooplankton, both of which were highly correlated with rates of river discharge (Table 3, rows 1, 2). In summary, although phytoplankton and zooplankton were strongly correlated with one another, both were also correlated with the rate of river discharge. The autoregressive parameters for these relationships were ɸ = 0.65, p = 0.15; ɸ = 0.50, p = 0.20; ɸ = 0.70, p = 0.12, for flow, phytoplankton, and zooplankton, respectively. However, when the effect of river flow was removed, yielding time series of residuals that were not autocorrelated, we found that there was no correlation between phytoplankton and zooplankton (Table 3, row 3).
| Year | Biomass | Bioenergetics | Size frequency | Increment summation |
|---|---|---|---|---|
| 2006 | 13.56 | 0.064 | 0.28 | 0.13 |
| 2007 | 13.52 | 0.032 | 0.29 | 0.13 |
| 2008 | 12.35 | 0.061 | 0.45 | 0.22 |
| 2009 | 17.74 | 0.111 | 0.45 | 0.19 |
| 2010 | 14.84 | 0.109 | 0.43 | 0.22 |
| 2011 | 2.70 | 0.021 | 0.06 | 0.03 |
| 2012 | 14.17 | 0.100 | 0.36 | 0.17 |
| 2013 | 18.68 | 0.135 | 0.49 | 0.35 |
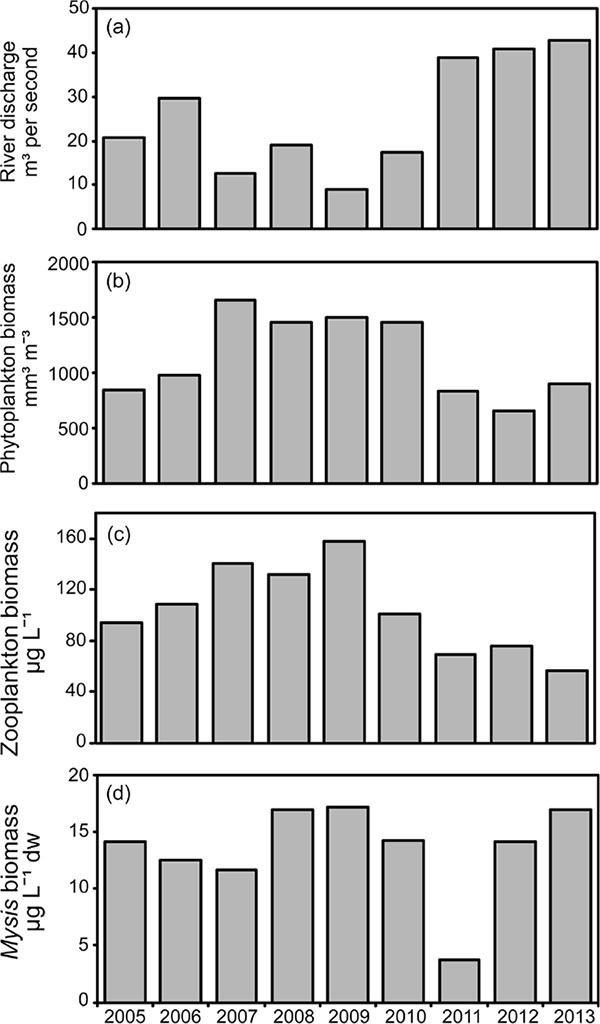 |
Fig. (5). (a) Average river discharge (m3s-1) recorded at Oliver, British Columbia between May and October of each year. (b) Average (May-October) phytoplankton biomass recorded as mm3m-3 (which approximates µg L-1 wet weight). (c) Average (May-October) zooplankton biomass recorded as µg L-1 dry weight. (d) Average (May-October) Mysis biomass recorded as µg L-1 dry weight. |
There were no correlations found between mean annual (June-October) Mysis biomass Fig. (5) and any of river discharge, algal biomass or zooplankton biomass (Table 3, rows 4, 5, 6).
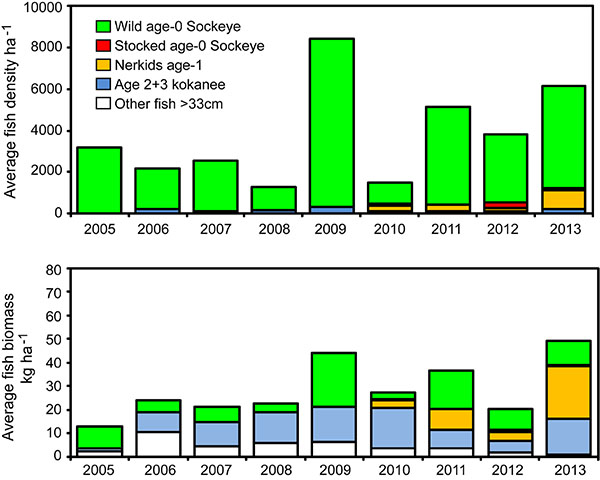 |
Fig. (6). Top panel: Average density (Numbers ha-1) based on 5-7 acoustic and trawl surveys completed between July and winter of each year. Bottom panel: Average biomasses (kg ha-1) based on lengths and weights of sampled fish and abundance estimates from the same surveys. |
| Row | First correlation variable | Second correlation variable | Pearson’s correlation coefficient | p (untransformed data) | p (transformed data) | - |
|---|---|---|---|---|---|---|
| Potential bottom up correlations | - | - | - | - | - | |
| 1 | River discharge | Total algal biomass | -0.86 | 0.002 | 0.006 | sig |
| 2 | River discharge | Total zooplankton biomass | -0.91 | 0.001 | 0.018 | sig |
| 3 | Phytoplankton | Zooplankton | 0.24 | 0.267 | ns | |
| 4 | River discharge | Mysis biomass | -0.26 | 0.248 | 0.065 | ns |
| 5 | Total algal biomass | Mysis biomass | 0.24 | 0.264 | 0.167 | ns |
| 6 | Total zooplankton biomass | Mysis biomass | 0.24 | 0.263 | 0.107 | ns |
3.4. Limnetic Fish Density, Growth and Survival
We were unable to separate age-0 Sockeye and age-0 kokanee, but based on spawner counts, >99% of the limnetic age-0 nerkids identified from the trawl and acoustics samples were likely wild Sockeye fry, and <1% were kokanee fry (Fig. 6, top).
Throughout 2005-13, densities of age-0 nerkids generally varied in proportion to total recruitment of adult Sockeye spawning in the Okanagan River the previous fall (Fig. 7). Two years were exceptions. In 2010, wild nerkid fry were derived from 64,000 adult Sockeye, but egg-to-fry survival may have been compromised by effluents introduced to Osoyoos Lake from an earthen dam breach on Testalinden Creek [83]. By contrast, fry in 2011 were derived from a record number of 210,000 adult Sockeye that competed for limited numbers of spawning sites with obvious superimposition of redds. The high degree of redd superimposition (Hyatt et al., unpublished observations) appears to have depressed subsequent fry recruitment far below expectation.
Trawl and acoustics data indicated that densities of hatchery-origin Sockeye fry, age-2 and -3 kokanee, and other fish >33cm, made relatively negligible contributions to total abundance of limnetic fish in all years (Fig. 6, top). The exception was hatcheryorigin, age-1 Sockeye (i.e. Fig. 6, nerkids age-1). In most years, these hatchery fish (i.e. otolith marked) appeared briefly in Osoyoos Lake in the spring during their seaward migration down the Okanagan River from Skaha Lake. During 2010-12, some Skaha smolts remained through summer in Osoyoos Lake, and in 2013, larger numbers of smolts remained there through the July-winter assessment period (Fig. 6, top). These fish contributed substantially to community biomass recorded in 2013 (Fig. 6, bottom). Although older and larger age-2 to -3 kokanee and Lake Whitefish were relatively rare, they too accounted for substantial portions of total limnetic fish biomass in most years. Trawl and acoustics data suggested that egg-to-winter (i.e. pre-smolt) survivals of wild age-0 nerkids varied from 0.75% in the year of the dam breach to an average of 3.7% in the other years (Table 4).
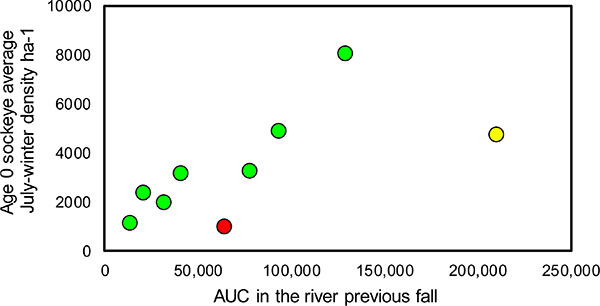 |
Fig. (7). Age-0 wild nerkid (> 99% wild age-0 Sockeye) density (average July-winter) with respect to spawner numbers estimated using area under the curve (AUC) methods in the previous fall. In 2010 (red data point), low recruitment was associated with a 2010 landslide from Testalinden Creek into the Okanagan River upstream of Osoyoos Lake. In brood year 2010 (in-lake year 2011; yellow data point), a record number of adults returned to spawn in the Okanagan River, and redd superimposition reduced spawning success. |
|
Brood year |
In-lake year |
WILD eggs produced by Osoyoos stock |
Eggs taken to hatchery |
WILD age-0 presmolt numbers per lake |
STOCKED age-0 sockeye pre-smolt numbers per lake |
STOCKED egg to pre-smolt survival (%) |
WILD egg to Pre-smolt survival (%) |
|---|---|---|---|---|---|---|---|
| 2004 | 2005 | 55,415,684 | 0 | 1,771,947 | - | - | 3.20 |
| 2005 | 2006 | 41,948,324 | 0 | 1,833,357 | - | - | 4.37 |
| 2006 | 2007 | 30,561,209 | 0 | 2,050,636 | - | - | 6.71 |
| 2007 | 2008 | 17,960,771 | 0 | 874,135 | - | - | 4.87 |
| 2008 | 2009 | 177,986,744 | 0 | 6,998,054 | - | - | 3.93 |
| 2009 | 2010 | 85,151,316 | 567,810 | 638,214 | 83,566 | 14.72 | 0.75 |
| 2010 | 2011 | 315,471,237 | 0 | 4,310,465 | - | - | 1.37 |
| 2011 | 2012 | 109,204,863 | 1,051,500 | 2,464,053 | 243,513 | 23.16 | 2.26 |
| 2012 | 2013 | 135,698,468 | 1,115,460 | 3,614,442 | 62,511 | 5.60 | 2.66 |
| - | - | - | - | - | Average | 14.49 | 3.35 |
In all years, the growth of wild age-0 nerkids was similar through late summer, after which there were substantial between-year variations (Fig. 8). Year 2008 stands out as a year when age-0 nerkids grew at near-average rates until September and then exhibited accelerated growth in weight through the fall to winter (Fig. 8), bottom and during that year we observed the highest von Bertalanffy weight asymptote (W∞) recorded during 2005-13 (Table 5). This growth spurt was also associated with the largest number of Mysis found in the annual diets of these fry (Fig. 9). Year 2010 had the second highest rate of growth, the second highest von Bertalanffy W∞ and the second highest number of Mysis observed annually in fry diets (Fig. 9). Year 2007 stands out as a year in which age-0 nerkids grew slowly in weight. During that year age-0 nerkids had the lowest von Bertalanffy W∞ (Table 5) and the lowest number of Mysis found in fry guts. The von Bertalanffy growth coefficient K remained relatively stable in all years (Table 5).
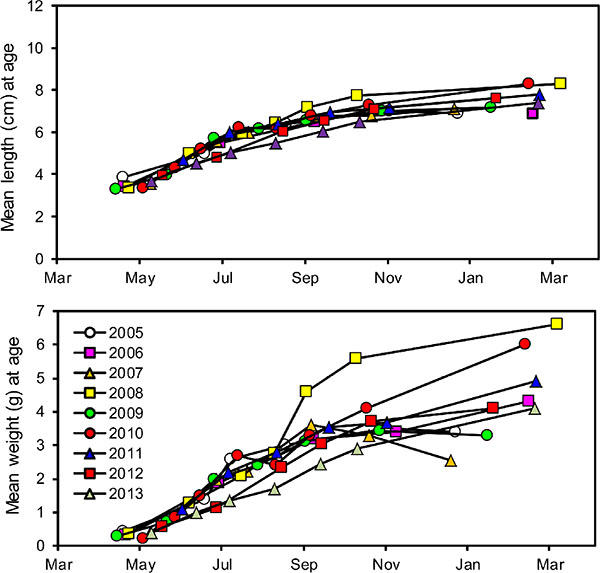 |
Fig. (8). Years 2005-13 summary of seasonal changes in average age-0 nerkid length (top panel) and wet weight (bottom panel). |
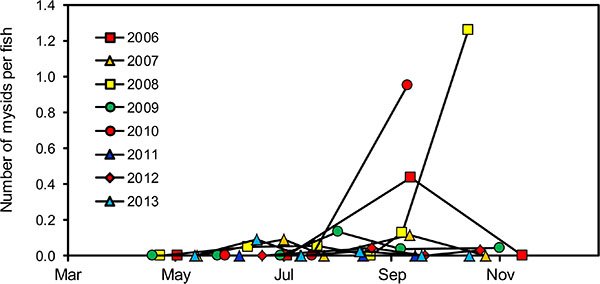 |
Fig. (9). Average number of Mysis found in the guts of wild nerkid fry between spring and early winter in each year from 2006-13. |
| In-lake Year | W∞ | K (Growth Coefficient) |
|---|---|---|
| 2005 | 3.69 | 0.0155 |
| 2006 | 4.24 | 0.0130 |
| 2007 | 3.53 | 0.0114 |
| 2008 | 7.02 | 0.0152 |
| 2009 | 3.59 | 0.0157 |
| 2010 | 6.51 | 0.0109 |
| 2011 | 4.73 | 0.0140 |
| 2012 | 4.26 | 0.0170 |
| 2013 | 4.28 | 0.0115 |
3.5. Potential Bottom-up and Top-Down Correlations
Zooplankton biomass was not correlated with any of the measures associated with growth rate of age-0 nerkid fry (i.e. November weight, von Bertalanffy W∞ and K; Fig. 10; Table 6, rows 1, 2, 3). However, total zooplankton biomass, the biomass of Daphnia, and the biomass of Epischura, were all strongly associated with age-0 nerkid survival (Table 6, rows 4, 5, 6). There were no correlations between Mysis biomass and any of von Bertalanffy W∞ or K for age-0 fry or egg-to-smolt survival (Table 6, rows 7, 8, 9).
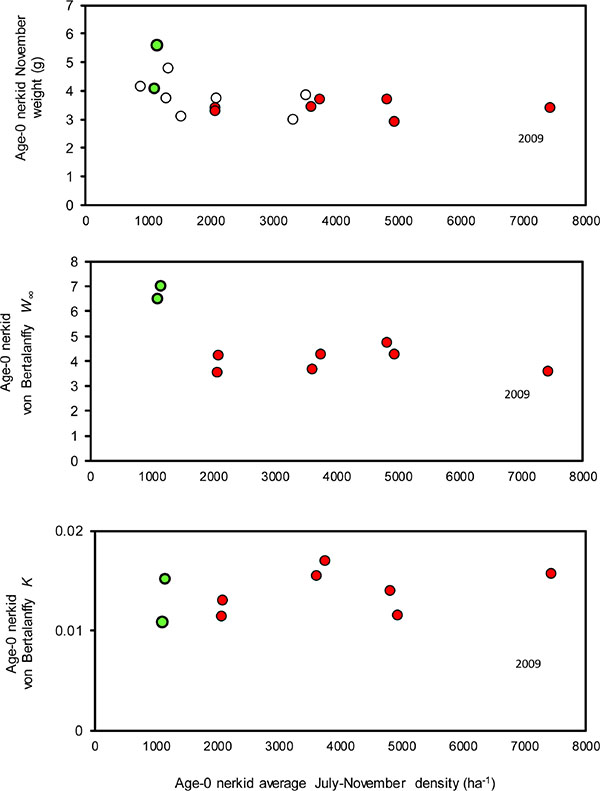 |
Fig. (10). Top panel: Relationship between the age-0 nerkid density and average weight of wild fry recorded in November in each of years 2005-13 (solid points, 2008 and 2010 in green). November weights from 1997-2004 (open symbols) (Hyatt unpublished data) have been added for comparison. Middle panel: Age-0 nerkid von Bertalanffy W∞ with respect to age-0 nerkid density. Bottom panel: Age-0 nerkid von Bertalanffy K with respect to age-0 nerkid density. |
Average age-0 nerkid density (average July-Winter) was negatively associated with age-0 von Bertalanffy W∞ (Fig. 11; Table 6, row 10), but other measures of age-0 growth rates were not correlated with age-0 nerkid density, age-0 nerkid biomass or total limnetic fish biomass (Table 6, rows 11, 12, 13, 14). Similarly, age-0 nerkid rates of survival were not correlated with age-0 nerkid density, or age-0 nerkid biomass or the biomass of all fish together (Table 7, rows 15, 16, 17).
There were no correlations between any of the measures of fish abundance (i.e. age-0 nerkid density, or age-0 nerkid biomass or the biomass of all fish together) and their prey (i.e. total zooplankton biomass and Mysis biomass) Table 6, rows 18, 19, 20, 21, 22, 23).
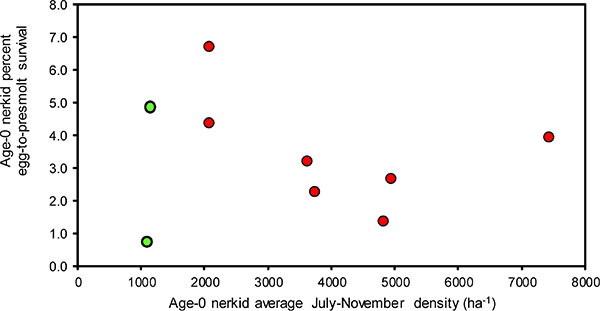 |
Fig. (11). Relationship between the age-0 nerkid density and egg-to-pre-smolt survival of age-0 nerkid fry. |
3.6. Zooplankton Consumption by Mysis and Limnetic Fish
Through 2005-13, bioenergetics simulations were used to estimate the biomasses of prey consumed by each of the five groups of planktivorous fish. Through 2009-13, bioenergetics modelling was also used to estimate the biomasses of prey consumed, not only by fish, but also by Mysis. Based on a comparison of 2009-13 consumption rates, Mysis consumed 64% of zooplankton and all of the fish together consumed 35% of zooplankton biomass (excluding Mysis) (Table 7).
Wild nerkid fry consumed 53% by weight of all zooplankton (including Mysis) consumed by all limnetic fish (Table 8). Due to their relatively large body sizes, age-2 and age-3 kokanee represented a substantial portion of the total fish biomass (Fig. 6). Rates of consumption by these two groups were modelled separately and added together for this analysis. Together age-2 and age-3 kokanee accounted for 18% of the total zooplankton consumed by all fish. Age-1 nerkids (mostly Sockeye smolts) accounted for 20%, and stocked Sockeye and Lake Whitefish accounted for 2% and 7%, respectively, of all zooplankton (including Mysis) consumed by fish.
Among-year consumption of zooplankton by Mysis remained relatively stable, reflecting similar Mysis biomasses in all years except 2011. In that year, Mysis biomass declined precipitously and, as predators, they consumed only 31% of all zooplankton eaten by fish and mysids (Table 7).
In order of priority, the most important prey consumed by fish and Mysis together during 2009-2013 were Daphnia, which accounted for an all-year average of 38% by weight of all zooplankton consumed during June-October 2009-13 (Table 7). Diacyclops (22%) were the second most important, followed by Mysis (9%), Epischura (9%), Bosmina (8%), chironomids (4%), Leptodiaptomus (2%), Diaphanosoma (2%), Leptodora (2%) and dipterans (1%).
There was only moderate prey overlap between the fish and Mysis. For fish, the top three prey species (2009-2013) included Daphnia = 24% by weight of the total fish diet, Epischura = 23%, and Mysis = 22%. For Mysis, the top three prey species included Daphnia = 47%, Diacyclops = 31% and Bosmina = 13% (Table 7). Horn’s index [71] for niche overlap between Mysis and all fish species in Osoyoos Lake was 0.51 (95% confidence limits: 0.05, 1.12). Both fish and Mysis consistently consumed Daphnia and Diacyclops, and both occasionally consumed Leptodiaptomus and Diaphanosoma. Fish alone consumed Mysis, Epischura, chironomids, dipterans and Leptodora. Mysis alone consumed Bosmina and rotifers (Table 7). Although age-0 nerkids consumed Mysis in some years, they did not do so until early fall when the fry reached a length of about 7 cm. The limnetic prey consumed by large (>33 cm) Lake Whitefish were restricted to chironomids and Mysis, both of which they may have captured in the benthos.
| Row | First correlation variable | Second correlation variable | Pearson's r | p (Untrans-formed data) | p (Trans-formed data) | |
|---|---|---|---|---|---|---|
| Potential bottom up correlations | - | - | - | - | - | |
| 1 | Total zooplankton biomass | Age-0 nerkid November weight | 0.28 | 0.23 | 0.21 | ns |
| 2 | Total zooplankton biomass | Age-0 nerkid Von Bertalanffy W∞ | -0.04 | 0.46 | 0.10 | ns |
| 3 | Total zooplankton biomass | Age-0 nerkid Von Bertalanffy K | 0.11 | 0.39 | 0.27 | ns |
| 4 | Total zooplankton biomass | Age-0 nerkid survival | 0.80 | 0.01 | - | sig |
| 5 | Daphnia biomass | Age-0 nerkid survival | 0.76 | 0.01 | - | sig |
| 6 | Epischura biomass | Age-0 nerkid survival | 0.80 | 0.01 | - | sig |
| 7 | Mysis biomass | Age-0 nerkid Von Bertalanffy W∞ | -0.18 | 0.32 | - | ns |
| 8 | Mysis biomass | Age-0 nerkid Von Bertalanffy K | -0.11 | 0.39 |
- | ns |
| 9 | Mysis biomass | Age-0 nerkid survival | 0.32 | 0.22 | ns | |
| Potential top-down correlations | - | - | - | - | - | |
| 10 | Age-0 nerkid density | Von Bertalanffy W∞ | -0.60 | 0.04 | - | sig |
| 11 | Age-0 nerkid density | Von Bertalanffy K | 0.37 | 0.16 | - | ns |
| 12 | Age-0 nerkid density | Age-0 nerkid November weight | -0.53 | 0.07 | - | ns |
| 13 | Age-0 nerkid biomass | Age-0 nerkid November weight | -0.38 | 0.16 | - | ns |
| 14 | All limnetic fish biomass | Age-0 nerkid November weight | -0.34 | 0.19 | - | ns |
| 15 | Age-0 nerkid density | Age-0 nerkid survival | -0.51 | 0.10 | - | ns |
| 16 | Age-0 nerkid biomass | Age-0 nerkid survival | -0.41 | 0.16 | - | ns |
| 17 | All limnetic fish biomass | Age-0 nerkid survival | -0.35 | 0.19 | - | ns |
| 18 | Age-0 nerkid density | Total zooplankton biomass | -0.08 | 0.42 | 0.14 | ns |
| 19 | Age-0 nerkid biomass | Total zooplankton biomass | 0.09 | 0.41 | 0.15 | ns |
| 20 | All limnetic fish biomass | Total zooplankton biomass | -0.11 | 0.39 | 0.21 | ns |
| 21 | Age-0 nerkid density | Mysis biomass | 0.12 | 0.37 | - | ns |
| 22 | Age-0 nerkid biomass | Mysis biomass | -0.06 | 0.44 | - | ns |
| 23 | All limnetic fish biomass | Mysis biomass | 0.00 | 0.5 | - | ns |
3.7. Proportions of Prey Biomass and Production Consumed by Fish and Mysis
During 2009-13, consumption of zooplankton by the limnetic predators (Mysis plus all fish) accounted for average daily losses of only 4.5% of zooplankton biomass and 34% of zooplankton production, not including Mysis as prey (Table 9). However, the effects of consumption by the limnetic predators varied greatly from year to year and from prey species to prey species. For example, Bosmina were eaten almost exclusively by Mysis, which consumed an average of 7.7% of Bosmina biomass and 68% of Bosmina production per day (Table 9). Daphnia were targeted by both fish and Mysis, and during 2009-13, daily consumption by both accounted for 7.8% of biomass and 69% of daily Daphnia production. Estimates of planktivore consumption of zooplankton production, based on the size frequency and increment sum methods, were almost always lower than they were for the egg-ratio method (Table 9).
Consumption rates for fish and Mysis on all of the other zooplankton species were consistently low, and biomasses of zooplankton that potentially served as alternative prey remained relatively stable (Fig. 2; Table 1). During 2009-13, bioenergetics-based daily consumption by fish accounted for average losses of 1.0% of Mysis biomass and 136% of daily Mysis production (Table 9). Estimated losses of Mysis production based on the size frequency and increment sum methods were lower, averaging 65% per day for increment sum and 135% per day for the size frequency method (Table 9).
4. DISCUSSION
During the late 20th century, Sockeye Salmon escapement into the Okanagan River and Osoyoos Lake fell from an average of 50,000 to <5,000 adults. This trend resulted in concerted efforts by the Okanagan Nation Alliance (ONA), the Colville Confederated Tribes, government agencies, and Columbia River power producers, to support several programs (i.e. spawning bed restoration, refinement of flow regulation of the Okanagan River, enhanced monitoring and management) to rebuild the Okanagan River Sockeye Salmon population. During the implementation of these programs in the early 2000s, it was discovered that Mysis diluviana had moved downstream from Lake Okanagan and had invaded Osoyoos Lake. Because juvenile Sockeye, juvenile kokanee and mysids all consume similar zooplankton prey, our study objective was to determine whether invasive mysids would impede or prevent rebuilding of Sockeye Salmon stocks to historical levels.
4.1. Influence of External Events
As our study progressed through 2005-13, it became apparent that forces external to the Osoyoos Lake food web strongly influenced events within the food web. (1) Wild Sockeye Salmon fry abundance was strongly influenced by adult Sockeye return variations (Fig. 7) that resulted in a nearly five-fold change in age-0 nerkid average density. (2) In addition, changes in rates of discharge from the Okanagan River were associated with large variations in zooplankton biomass (Fig. 5). (3) Also, an earthen-dam failure event, upstream of Osoyoos Lake, was associated with reduced age-0 nerkid densities during 2010, and with a substantial reduction of juvenile Mysis recruitment in 2010 that affected the biomass of all Mysis in Osoyoos Lake in 2011 (Figs. 4, 5).
Rates of Okanagan River water discharge from the Penticton dam located at the south end of Lake Okanagan are continuously monitored [47]. During the summer of 2011-13, increased precipitation and above-average winter snowpack necessitated much higher water-release rates than during 2005-10. Okanagan Lake water accounts for >80% of the water that feeds into Osoyoos Lake [84]. Changes in discharge rates were associated with changes in algal biomass and zooplankton biomass. May-October cumulative river discharge during 2005-10 averaged 0.28 km-3, but during 2011-13, the discharge from Okanagan Lake and the Okanagan River into Osoyoos Lake ranged between 0.62-0.68 km3 (Fig. 5). The north basin of Osoyoos Lake measures 7.5 km in length and has a volume of 0.25 km3 so that these river flows created May-October average annual turnover rates of 2.2 epilimnetic volumes in 2005-10, and 5.0 epilimnetic volumes during 2011-13. May-October turnover rates for the entire north basin of Osoyoos Lake averaged 1.0 annually in 2005-10 and 2.4 in 2011-13. There were significant negative relationships between river flow rates and the biomasses of algae and zooplankton (Table 3; Fig. 5). The result was that during 2005-13, there was roughly a three-fold variation in the biomass of zooplankton potentially available as a food source for age-0 nerkids and Mysis (Figs. 3, 5). This variation was independent of any effects that nerkid fry density might have had on zooplankton biomass.
The second important external physical event occurred on 13 June 2010, when the failure of an earthen dam caused a debris torrent at Testalinden Creek, near Oliver BC, located on the Okanagan River 10 km north of Osoyoos Lake [83]. The slide introduced substantial quantities of sediment and unknown quantities of agricultural chemicals into the Okanagan River and subsequently into Osoyoos Lake. This event was associated with the apparent failure of many age 1.0 smolts to leave the lake during April-May 2011 as they had done during 2005-09 (Fig. 6). It was also associated with an unexpected loss of about 2.5 million wild Sockeye fry (Figs. 6, 7) and with relatively poor survival (14.7%) of about 84,000 hatchery-fry stocked in 2010 versus the higher survival (23.2%) of 244,000 hatchery-fry stocked in summer 2012 (Table 4). Finally, input of Testalinden effluent into Osoyoos Lake was associated with changes in Mysis biomass. During the fall-winter of 2010-11, Mysis embryo production was the lowest ever observed, and this was associated with 2011 Mysis biomasses that were the lowest recorded over the nine-year study interval (Fig. 4). Within the Osoyoos Lake food web, these strong external events created unexpectedly high contrast in the densities and biomasses of zooplankton and fish, and this fortuitously enhanced the potential to detect associations between prey (zooplankton and Mysis), predators (age-0 nerkids, other fish, and Mysis) and competitors (fish and Mysis). Despite this variability, we detected only four significant correlations involving fish, Mysis and zooplankton among the 23 that were investigated (Table 6).
The first significant correlation was the density-dependent relationship between age-0 nerkid growth (i.e. von Bertalanffy W∞) and the density of age-0 nerkids (Table 6, row 10). This relationship was non-linear. When age-0 nerkid densities were <1500 fry ha-1, November weights and von Bertalanffy W∞ were higher than they were at densities ranging from 1500-8000 ha-1 (Fig. 10). In Osoyoos Lake, this relationship explained a secondary relationship between the density of age-0 nerkids and the prevalence of Mysis in their diets. For example during 2008, wild fry grew at normal rates until September and then grew very quickly through the fall-winter. This accelerated growth was associated with the largest number of Mysis found in fry diets (Fig. 9). Year 2010 had the second-highest rate of growth and the second highest number of Mysis per wild fry gut. Year 2007 had the lowest rate of wild fry growth, and this was associated with very low numbers of Mysis found in age-0 nerkid guts. From this we conclude that at very low fry densities (<1500 ha-1) Mysis become more available, and their large size and higher energy content account for the higher growth rates exhibited by juvenile Sockeye. It should be noted that this does not apply to the availability of other zooplankton. Through 2005-13, zooplankton biomasses varied by a factor of three (Fig. 3), possibly related to changes in flushing rate (Table 3, row 2; Fig. 5), but there were no correlations between zooplankton biomass and any measure of age-0 growth (Table 6, rows 1, 2, 3).
The remaining three significant relationships all involved positive bottom-up associations between age-0 nerkid survival and various measures of zooplankton biomass (Table 6, rows 4, 5, 6). These relationships were not dependent on other top-down food-web relationships that might have been related. For example, there was no relationship between age-0 survival and the abundance or biomass of age-0 nerkids, or the biomass of all fish, or the biomass of Mysis (Table 6, rows 15, 16, 17, 9). From this, we conclude that variations in zooplankton biomass were associated with factors external to the Osoyoos Lake food web (i.e. flushing rate), and that when zooplankton biomasses were higher, age-0 nerkids survived better.
4.2. Could Fish and/or Mysis Control Zooplankton Biomass?
During 2009-13 Mysis accounted for 64% and fish accounted for 35% of the zooplankton biomass (excluding Mysis) consumed by fish and Mysis together. Combined consumption by fish and Mysis also accounted for daily losses of 4.5% of zooplankton biomass and 34% of daily zooplankton (excluding Mysis) production. On a seasonal basis (June-October), these rates suggest that prey consumption by fish and Mysis together was unlikely to have any effect on total zooplankton biomass.
However, there were large differences among combined fish and Mysis predation impacts during different time periods on various species of prey. (i) Bosmina were consumed essentially only by Mysis (Table 7). During 2009-13, Mysis consumed an average of 8% d-1 of Bosmina biomass and 65% d-1 of Bosmina production from (Tables 1, 7). These rates suggest that Bosmina biomasses may have been regulated by Mysis. In fact, during all years, Osoyoos Lake Bosmina biomasses were very low (Fig. 3; Table 1), and during 2011-13 (higher discharge years), when consumption by Mysis accounted, on average, for 102% of Bosmina production per day, Bosmina biomass was only half as high as it was during 2009-10 (lower discharge years) when consumption by Mysis accounted, on average, for only 34% of Bosmina production (Table 9). (ii) Daphnia were consumed by both fish and Mysis (Table 7). During 2009-13, both predators together consumed 8% of Daphnia biomass and 69% of Daphnia production (Table 9), and Mysis consumed more than twice as much Daphnia as fish did (Table 7). During 2009-10, fish and Mysis together consumed 39% d-1 of Daphnia production (Table 9), and Daphnia biomass averaged 16.8 µg L-1 (Table 1). During 2011-13, fish and Mysis together consumed an average of 90% of daily production by Daphnia (Table 9) and Daphnia biomass averaged only 3.9 µg L-1 (Table 1). Consequently, it appears that when exogenous climate events reduce cladoceran production, it is possible for the combined cropping pressure of fish and Mysis to control the biomass of their principal cladoceran prey.
| Year | Bosmina | Diaphanosoma | Diacyclops | Daphnia | Epischura | Leptodiaptomus | Mysis | Chironomids | Rotifers | Leptodora | Dipteran | Total | |
| Consumption by fish (µg L-1 d-1 dry weight) | |||||||||||||
| 2006 | 0.00 | 0.00 | 0.03 | 0.03 | 0.05 | 0.00 | 0.08 | 0.03 | 0.00 | 0.00 | 0.00 | 0.22 | |
| 2007 | 0.00 | 0.00 | 0.02 | 0.01 | 0.04 | 0.00 | 0.02 | 0.00 | 0.00 | 0.00 | 0.00 | 0.09 | |
| 2008 | 0.00 | 0.00 | 0.01 | 0.03 | 0.06 | 0.01 | 0.05 | 0.02 | 0.00 | 0.00 | 0.02 | 0.19 | |
| 2009 | 0.00 | 0.00 | 0.08 | 0.29 | 0.14 | 0.00 | 0.17 | 0.02 | 0.00 | 0.01 | 0.01 | 0.73 | |
| 2010 | 0.00 | 0.00 | 0.02 | 0.09 | 0.06 | 0.00 | 0.11 | 0.04 | 0.00 | 0.06 | 0.01 | 0.39 | |
| 2011 | 0.00 | 0.00 | 0.10 | 0.32 | 0.13 | 0.00 | 0.04 | 0.10 | 0.00 | 0.01 | 0.04 | 0.75 | |
| 2012 | 0.00 | 0.03 | 0.02 | 0.07 | 0.07 | 0.02 | 0.13 | 0.05 | 0.00 | 0.03 | 0.03 | 0.45 | |
| 2013 | 0.01 | 0.04 | 0.04 | 0.00 | 0.28 | 0.10 | 0.20 | 0.05 | 0.00 | 0.00 | 0.03 | 0.74 | |
| Mean (`09-`13) | - | 0.00 | 0.01 | 0.05 | 0.16 | 0.14 | 0.02 | 0.13 | 0.05 | 0.00 | 0.02 | 0.02 | 0.61 |
| Mean (`06-`13) | - | 0.00 | 0.01 | 0.04 | 0.11 | 0.10 | 0.02 | 0.10 | 0.04 | 0.00 | 0.01 | 0.02 | 0.45 |
| Percent of diet | - | 0 | 2 | 9 | 24 | 23 | 4 | 22 | 9 | 0 | 3 | 3 | - |
| Consumption by Mysis (µg L-1 d-1 dry weight) | |||||||||||||
| 2009 | 0.10 | - | 0.24 | 0.48 | - | 0.16 | - | - | 0.02 | - | - | 1.00 | |
| 2010 | 0.05 | 0.07 | 0.41 | 0.38 | - | 0.01 | - | - | 0.00 | - | - | 0.92 | |
| 2011 | 0.13 | 0.00 | 0.12 | 0.07 | - | 0.02 | - | - | 0.00 | - | - | 0.33 | |
| 2012 | 0.09 | 0.00 | 0.28 | 0.46 | - | 0.03 | - | - | 0.01 | - | - | 0.86 | |
| 2013 | 0.17 | 0.00 | 0.26 | 0.58 | - | 0.01 | - | - | 0.04 | - | - | 1.06 | |
| Mean | 0.11 | 0.02 | 0.26 | 0.39 | - | 0.04 | - | - | 0.01 | - | - | 0.84 | |
| Percent of diet | - | 13 | 2 | 31 | 47 | - | 5 | - | - | 2 | - | - | - |
These rates of consumption by Mysis are similar to those observed in Lake Pend Oreille [37-39]. Osoyoos Lake in 2011-13, and Lake Pend Oreille in 1995 and 1996, had similar average summer Daphnia densities (average 200-500 ha-1), and the average summer consumption rates by Mysis in both lakes were also similar (213 Daphnia m-3 d-1 consumed in Osoyoos Lake, 273 Daphnia m-3d-1 consumed in Lake Pend Oreille [39]. (iii) In contrast to the cladocerans, Osoyoos Lake copepods seemed unaffected by fish or Mysis predation. During 2009-13, Mysis and fish consumed only 26% d-1 of Diacyclops production and 4% d-1 of Leptodiaptomus production (Table 9). Together these two species account for >73% of the Osoyoos Lake total zooplankton biomass, averaged for 2009-2013, which accounts for the fact that fish and Mysis together consume only 4.5% of total zooplankton biomass and 34% of total zooplankton production (Table 9). This also accounts for the fact that the total zooplankton biomass was not associated with Mysis biomass (Table 3, row 6) or with the densities or biomasses of age-0 nerkids and other fish (Table 6, rows 18, 19, 20).
It should be reiterated that the preceding results (Table 9) and conclusions (Table 6) have been based on rates of zooplankton production from the egg-ratio method and rates of Mysis production from the bioenergetics method (Tables 1, 2). However, we also calculated rates of zooplankton and Mysis production using both the size frequency and the increment summation methods (Tables 1, 2). In almost all cases, these methods produced production estimates that were higher than the egg-ratio estimates (zooplankton) or bioenergetics (Mysis). Using these alternative methods of estimating rates of prey production almost always resulted in lower percentages of prey production consumed by the predators (Table 9). The implication is that estimates of zooplankton production from the egg-ratio method and Mysis production from bioenergetics yield a conservative conclusion that the impacts of fish and Mysis are unlikely to generally exert top-down control on their zooplankton prey in Osoyoos Lake.
4.3. Could Fish Control Mysis Biomass?
Osoyoos Lake Mysis were very vulnerable to predation by fish (Tables 7, 9). During 2009-13, consumption by fish accounted for average daily losses of 1.0% of Mysis biomass (Table 9), suggesting that about three months of continuous predation could substantially reduce the Mysis population. In fact during each year, Mysis biomass generally increased from early summer through fall and then fell rapidly, leaving only a residual adult population to reproduce during the winter (Fig. 4). In some ways, this pattern appears to be associated with the Osoyoos Lake Mysis life cycle, which restricts Mysis embryo production to the winter months when the lake is cold and fish metabolic rates are low. This life cycle is rare but not unique. Chess and Stanford [85] reported that Mysis in Flathead Lake has a one-year life cycle. The Flathead Lake population was introduced from Waterton Lake where Mysis have a two-year life cycle. Chess and Stanford [85] attribute these differences to the species of prey available in the two lakes (i.e.Daphnia thorata in Flathead Lake and Leptodiaptomus sicilis in Waterton Lake). Mysis in nearby Skaha Lake also have a one year life cycle but begin reproduction in September of each year [86]. Many other larger-lake Mysis populations have two-year life cycles, including populations found in Lake Okanagan [40], Kalamalka Lake [40], and Lake Pend Oreille [37]. Despite their unusual one-year life cycle and higher productivity, Osoyoos Lake Mysis are very vulnerable to predator-induced population declines. As noted above, embryo production by Mysis was greatly reduced during the winter of 2010-11, subsequent to the occurrence of a landslide that introduced sediment and agricultural chemicals into Osoyoos Lake. This event was followed by a significant decline in 2011 Mysis biomass (Fig. 4) and proportionally very heavy fish-induced losses to 2011 Mysis standing stocks (Table 9). However, during the winter of 2012, enough gravid females survived to re-establish the population, and Mysis biomasses rapidly rebuilt in 2012-13 (Fig. 4). This seasonally mediated resilience may explain the fact that there were no correlations between Mysis average biomass and densities or Mysis biomass and biomasses of age-0 nerkids or other fish (Table 6, rows 19, 20, 21). Although the observations above do suggest that fish may exert sufficient cropping pressure to influence seasonal biomass of Mysis, they also suggest that even extreme circumstances (e.g. extremely low recruitment of Mysis paired with high recruitment of fish) are unlikely to eliminate Mysis from Osoyoos Lake.
| Year | Wild age-0 nerkids | Stocked age-0 sockeye | Nerkids age-1 | Age 2+3 kokanee | Other fish >33 cm | Total |
|---|---|---|---|---|---|---|
| 2006 | 0.11 | 0 | 0 | 0.05 | 0.07 | 0.23 |
| 2007 | 0.14 | 0 | 0 | 0 | 0.01 | 0.15 |
| 2008 | 0.09 | 0 | 0 | 0.06 | 0.03 | 0.18 |
| 2009 | 0.57 | 0 | 0 | 0.11 | 0.03 | 0.71 |
| 2010 | 0.08 | 0.03 | 0.1 | 0.151 | 0.02 | 0.38 |
| 2011 | 0.41 | 0 | 0.24 | 0.070 | 0.03 | 0.75 |
| 2012 | 0.22 | 0.03 | 0.1 | 0.08 | 0.01 | 0.44 |
| 2013 | 0.27 | 0.01 | 0.29 | 0.140 | 0.04 | 0.75 |
| Mean ('06-'13) | 0.24 | 0.01 | 0.09 | 0.08 | 0.03 | 0.45 |
| Mean ('09-'13) | 0.31 | 0.01 | 0.15 | 0.11 | 0.03 | 0.61 |
| Percent | 53 | 2 | 20 | 18 | 7 | 100 |
4.4. Did the Mysisinvasion Damage the Sockeye Salmon Population Recovery?
Mysis stocking or invasions into nerkid lakes have usually been associated with negative impacts on nerkid biomass and recruitment. However, in Osoyoos Lake the result is equivocal. Nerkids and Mysis both consume Daphnia, and Mysis, as the principal predator of Daphnia, have substantial negative effects on Daphnia biomass and production (Table 7). In Osoyoos Lake, Daphnia also account for 24% of the prey biomass consumed by fish (2006-2013; Table 9). Age-0 nerkid survival also displays significant reductions in years like 2011-2013 when seasonal average biomass (May-Oct) of Daphnia is low (Table 6) and when Mysis accounts for consumption of 68% of daily production of Daphnia. Consequently, it appears that Mysis may compete with nerkids for limited supplies of Daphnia in some years and thus contribute to lowering the survival and recruitment of age-0 nerkids to the fall of the year. The impact of Mysis (as competitors) on fall recruitment of age-0 nerkids in Osoyoos Lake might be even greater except for the ability of the latter to also consume Mysis and Epischura as major prey accounting for 22% and 23% respectively of age-0 nerkid diet by weight.
The routine inclusion of Mysis as an important prey item in the diet of age-0 nerkids (Table 7) clearly reduces the potential harm by this invasive species to fish in Osoyoos Lake. This predator-prey dynamic may be related to lake depth as suggested by Schoen et al. [87]. During 1949-50, Kootenay Lake became the first kokanee lake stocked with M. diluviana [31]. The goal was to increase the production of kokanee that served as the principal prey of large Gerrard rainbow trout (Oncorhynchus mykiss). The initial result was that kokanee grew to very large sizes, and this apparently desirable outcome was followed by Mysis stocking in other western North America kokanee lakes where the result was frequently negative [31, 88]. The obvious difference between Kootenay Lake, where Mysis introduction benefited kokanee, and the other lakes where it did not, is that lake morphometry in the west arm of Kootenay Lake concentrated M. diluviana (then called M. relicta) so they could be exploited by kokanee (summarized in [7, 85]). The Kootenay Lake west arm and Osoyoos Lake are both relatively shallow as compared to some other kokanee lakes (Pend Oreille mean depth 164 m, Lake Tahoe mean depth 305 m, Flathead Lake mean depth 50 m). The relatively shallow depth (mean 21 m) of Osoyoos Lake may force Mysis into closer proximity with the fish so that they play the dual role characterized by intra-guild predation [29, 30].
| Bosmina | Diaphanosoma | D. thomasi | Daphnia | Epischura | L. ashlandi | Mysis | Chironomids | Rotifers | Leptodora | |
|---|---|---|---|---|---|---|---|---|---|---|
| Percent of prey standing stock consumed per day | ||||||||||
| 2009 | 4.4 | 0.0 | 0.6 | 3.0 | 2.8 | 0.4 | 0.9 | 1.2 | 0.5 | 0.7 |
| 2010 | 2.1 | 2.7 | 0.6 | 3.4 | 2.8 | 0.2 | 0.7 | 15.9 | 0.4 | 2.9 |
| 2011 | 11.1 | - | 1.1 | 9.2 | 8.0 | 0.1 | 1.6 | 21 | 0.3 | 1.0 |
| 2012 | 6.1 | 0.7 | 1.2 | 10.7 | 2.9 | 0.1 | 0.9 | 26.9 | 0.7 | 2.9 |
| 2013 | 14.9 | 0.9 | 1.9 | 12.9 | 5.0 | 0.6 | 1.0 | 22.6 | 9.1 | 0.0 |
| Average | 7.7 | 1.1 | 1.1 | 7.8 | 4.3 | 0.3 | 1.0 | 17.5 | 2.2 | 1.5 |
| Percent of prey production consumed per day | ||||||||||
| 2009 | 49 | 0.2 | 26 | 46 | - | 11 | 140 | nd | nd | nd |
| - | (9, 34) | - | (359, 2694) | (3, 5) | (38, 90) | - | - | - | ||
| 2010 | 21 | 6 | 26 | 32 | - | 1 | 93 | nd | nd | nd |
| - | (12, 37) | - | (173, 285) | (1, 17) | (49, 93) | - | - | - | ||
| 2011 | 125 | - | 15 | 106 | - | 1 | 188 | nd | nd | nd |
| - | (10, 11) | - | (293, 1260) | (1, 3) | (140, 331) | - | - | - | ||
| 2012 | 53 | 3 | 29 | 49 | - | 2 | 123 | nd | nd | nd |
| - | (16, 30) | - | (122, 287) | (1, 9) | (37, 77) | - | - | - | ||
| 2013 | 90 | 3 | 32 | 114 | - | 7 | 135 | nd | nd | nd |
| - | (24, 33) | - | (325, 691) | (5, 47) | (59, 82) | - | - | - | ||
| Average | 68 | 3 | 26 | 69 | - | 4 | 136 | - | - | - |
During 2009-13, fish consumption of all zooplankton including Mysis averaged 0.61 µg L-1 d-1. Mysis, as prey of fish, accounted for 22% (0.13 µg L-1 d-1) of pelagic fish diets and also acted as predators, consuming zooplankton at an average rate of 0.84 µg L-1 d-1 (Table 7). Thus, as a potential competitor with fish, Mysis consumed almost twice as much zooplankton (excluding Mysis) as the fish, but as prey they contributed 22% of the total diet by weight consumed by fish.
It is impossible to predict exactly how much the fish would benefit from the theoretical removal of Mysis, given its dual roles in Osoyoos Lake as a nerkid prey source and prey “sink”. However, Mysis’ influence on Daphnia as a principal food source of both Mysis and fish in Osoyoos Lake, as well as in other lakes, would appear to be the key to solving the riddle of these prey-source versus prey-sink interactions. During the last five years of the study (2009-13), June-October consumption by fish averaged 0.16 µg L-1 d-1Daphnia, 0.13µg L-1 d-1Mysis and 0.33 µg L-1 d-1 other prey (Table 7). Because the other prey of fish were seldom consumed by Mysis or, when consumed (e.g.Diacyclops) were very abundant, we might predict that fish would be little influenced by the removal of Mysis. Assuming that fish are able to exploit Daphnia at the same rate as Daphnia are consumed by Mysis, the theoretical removal of Mysis from the Osoyoos Lake food web would potentially augment fish diets with the 0.39 µg L-1 d-1 of Daphnia that Mysis currently remove on average (Table 7). However, fish would lose 0.13 µg L-1 d-1 of Mysis as food, leaving fish a potential net dietary gain of 0.26 µg L-1 d-1 from consumption of Daphnia. Given an average total daily ration of 0.61 µg L-1 d-1 from all prey sources (Table 7), a 0.26 µg L-1 d-1 gain represents a potential 43% increase in the total average daily ration of age-0 fish. Consequently, it appears that in Osoyoos Lake, nerkids could benefit energetically from the removal of Mysis, and could potentially exhibit enhanced growth.
The evidence above suggests that in addition to potentially influencing the daily ration of nerkids, if Mysis consumption reduces the standing crop of Daphnia, this has the potential to reduce survival of juvenile nerkids. However, because we did not find any strong associations between the 2005-13 seasonal means of Mysis biomass and biomass of Daphnia (results not shown), it appears that this influence of Mysis on fish is likely to occur only in years when exogenous factors (e.g. length of growing season, epilimnial flushing, nutrient load variations) reduce Daphnia production sufficiently that Mysis and fish may then control the seasonal biomass of Daphnia as their principal prey item. Determination of the frequency of occurrence of such conditions in Osoyoos Lake is beyond the scope of the current paper. However, because recent years of nerkid production in Osoyoos Lake have exceeded historic levels of decadal-scale production observed for O. nerka smolts as well as returning adults [89], it is clear that Mysis have not altered food webs of Osoyoos Lake sufficiently to preclude restoration of its anadromous population of Sockeye Salmon.
ETHICS APPROVAL AND CONSENT TO PARTICIPATE
Not applicable.
HUMAN AND ANIMAL RIGHTS
No animals/humans were used for studies that are the basis of this research.
CONSENT FOR PUBLICATION
Not applicable.
CONFLICT OF INTEREST
The authors declare no conflict of interest, financial or otherwise.
ACKNOWLEDGEMENTS
This study would not have been possible without the financial and in-kind support provided to the authors by Public Utility District No. 1 of Douglas County, Washington State; Fisheries and Oceans Canada (DFO), and the Okanagan Nation Alliance of Westbank, B.C. Field work extended over 9 years and involved surveys to generate diverse sets of observational data from physics to fish. Surveys were led by DFO personnel including Paul Rankin, Barry Hanslit and Rick Ferguson with supplemental support from ONA personnel including Deana Machin, Howie Wright, Shayla Lawrence, Chelsea Mathieu and Linnea Wiens. Finally, Margot Stockwell has our gratitude for providing editorial assistance and support in figure formatting at several stages in the development of this paper.
REFERENCES
| [1] | Chapman DC, Pevan A, Giorgi T, et al. Status of Sockeye Salmon in the mid-Columbia region 1995. |
| [2] | Hyatt KD, Rankin DP. A habitat based evaluation of Okanagan Sockeye Salmon escapement objectives. Can Stock Assessment Sec Res Doc 1999; 99-191. Available from: http://waves-vagues.dfo-mpo.gc.ca/Library/244185.pdf |
| [3] | Hyatt KD, Stockwell MM, Rankin DP. Impact and adaptation responses of Okanagan River Sockeye Salmon (Oncorhynchus nerka) to climate variation and change effects during freshwater migration: Stock restoration and fisheries management implications. Can Water Resour J 2003; 28: 689-711. |
| [4] | Hyatt KD, Alexander CAD, Stockwell MM. A decision support system for improving “fish friendly” flow compliance in the regulated Okanagan Lake and River System of British Columbia. Can Water Resour J 2015; 40(1): 87-110. |
| [5] | Bradford MJ. Comparative review of Pacific salmon survival rates. Can J Fish Aquat Sci 1995; 52: 1327-38. |
| [6] | Audzijonyte A, Vainola R. Diversity and distributions of circumpolar fresh- and brackish-water Mysis (Crustacea: Mysida): Descriptions of M. relicta Loven, 1862, M. salemaai n. sp., M. segerstralei n. sp. and M. diluviana n. sp., based on molecular and morphological characters. Hydrobiologia 2005; 544(1): 89-141. |
| [7] | Ashley K, McGregor I, Shepherd B, et al. Okanagan Lake action plan year 3 (1998) report. Fisheries Project Report No. RD 78. Fisheries Management Branch, Ministry of Fisheries, Province of British Columbia 1999. |
| [8] | Nesler TP, Bergersen EP, Eds. Amer Fish Soc Symposium 1991. |
| [9] | Eggers DM. The nature of prey selection by planktivorous fish. Ecol 1977; 58: 46-59. |
| [10] | Eggers DM. Limnetic feeding behavior of juvenile sockeye salmon in Lake Washington and predator avoidance 1. Limnol Oceanogr 1978; 23: 1114-25. |
| [11] | Eggers DM. Planktivore preference by prey size. Ecol 1982; 63: 381-90. |
| [12] | Jaenicke HW, Hoffman MS, Dahlberg ML. Food habits of sockeye salmon (Oncorhyncus nerka) fry and three spine stickleback in Lake Nunavaugaluk, Alaska, and strategy to improve sockeye salmon survival and growth. In Smith HD, Margolis L, and Wood CC, Eds. Sockeye salmon (Oncorhyncus nerka) population biology and future management. Can Spec Pub Fish AquatSci 1987; 96: 216-234. |
| [13] | Higgs DA, MacDonald JS, Levings CD, Dosanjh BS. Nutrition and feeding habits in relation to life history stage. In: Groot C, Margolis L, Clarke WC, Eds. Physiological Ecology of Pacific Salmon 1995; 161-315. |
| [14] | Shortreed KS, Morton KF. An assessment of the limnological status and productive capacity of Babine Lake, 25 years after the inception of the Babine Lake Development Project. Can Tec. Rep. Fish Aquat Sci 2316. 2000. |
| [15] | Hyatt KD, Ramcharan C, McQueen DJ, Cooper KL. Trophic triangles and competition among vertebrate (Oncorhynchus nerka, Gasterosteus aculeatus) and macroinvertebrate (Neomysis mercedis) planktivores in Muriel Lake, British Columbia, Canada. Ecoscience 2005; 12(3): 11-26. |
| [16] | McQueen DJ, Hyatt KD, Rankin DP, Ramcharan CJ. Changes in algal species composition affected juvenile sockeye salmon production at Woss Lake, British Columbia: A lake fertilization and food web analysis. N Am J Fish Manage 2007; 27: 369-89. |
| [17] | Ferguson RG. The interrelationships among the fish populations of Skaha lake, British Columbia and their significance in the production of Kamloops trout (Salmo gairdnerii kamloops Jordan). BA thesis 1949. |
| [18] | Taki D. Snake River sockeye salmon habitat and limnological research. Annual Report to Bonneville Power Administration, Portland, Or. Contract No 91B122548. Project No. 91-071-00. (BPA Report DOE/BP- 22548-6). 1999. |
| [19] | Stockwell JD, Johnson BM. Refinement and calibration of a bioenergetics-based foraging model for kokanee (Oncorhynchus nerka). Can J Fish Aquat Sci 1997; 54: 2659-76. |
| [20] | Lasenby DC, Langford RR. Feeding and assimilation of Mysis relicta. Limnol Oceanogr 1973; 18: 280-5. |
| [21] | Grossnickle NE. The herbivorous and predaceous habits of Mysis relicta in Lake Michigan. PhD thesis 1978. |
| [22] | Goldman CR, Morgan MD, Threlkeld ST, Angeli N. A population dynamics analysis of the cladoceran disappearance from Lake Tahoe, California-Nevada. Limnol Oceanogr 1979; 24: 289-97. |
| [23] | Morgan MC, Threlkeld ST, Goldman CR. Impact of the introduction of kokanee (Oncorhynchus nerka) and opossum shrimp (Mysis relicta) on a subalpine lake. J Fish Res Bd Can 1978; 35: 1572-9. |
| [24] | Threlkeld ST, Rybock JT, Morgan MD, Folt CL, Goldman CR. The effects of an introduced invertebrate predator and food resource variation on zooplankton dynamics in an ultraoligotrophic lake. In: Kerfoot WC, Ed. The evolution and ecology of zooplankton communities. Special Symposium III, Amer Soc Limnol Oceanogr. New England: University Press of New England 1980; pp. 555-568. |
| [25] | Rieman BE, Falter CM. Effects of the establishment of Mysis relicta on the macrozooplankton of a large lake. Trans Am Fish Soc 1981; 110: 613-20. |
| [26] | Furst M, Hammar J, Hill C, Bostrom U, Kinsten B. Effects of the introduction of Mysis relicta into impounded lakes in Sweden. Institute Freshwater Research 1984. |
| [27] | Furst M, Hammar J, Hill C. The introduction of Mysis relicta> in Sweden: Effects on fish in impounded lakes. Habitat modification and freshwater fisheries. In: Alabaster JS, Ed 1986; 202-6. |
| [28] | Nero RW, Sprules WG. Zooplankton species abundance and biomass in relation to occurrence of Mysis relicta (Malacostraca: Mysidacea). Can J Fish Aquat Sci 1986; 43: 420-34. |
| [29] | Holt RD, Polis GA. A theoretical framework for intraguild predation. Am Nat 1997; 149: 745-64. |
| [30] | Hart D. Intraguild predation, invertebrate predators, and trophic cascades in lake food webs. J Theor Biol 2002; 218(1): 111-28. |
| [31] | Northcote TG. Success, problems and control of introduced Mysis populations in lakes and reservoirs. Mysids in fisheries: hard lessons from headlong introductions. Am Fish S S.1991; 5-16. |
| [32] | Lasenby DC. Comments on the roles of Native and Introduced Mysis relicta in Aquatic Ecosystems. Mysids in fisheries: Hard lessons from headlong introductions. Am Fish S S.1991; 9: 17-22. |
| [33] | Richards R, Goldman C, Byron E, Levitan C. The mysids and lake trout of Lake Tahoe: A 25-year history of changes in the fertility, plankton, and fishery of an alpine lake. Mysids in fisheries: Hard lessons from headlong introductions. Am. Fish S S.1991; 9: 30-8. |
| [34] | Spencer CN, McClennand BR, Stanford JA. Shrimp stocking, salmon collapse and eagle displacement: Cascading interactions in the food web of a large aquatic ecosystem. Biosci 1991; 41: 14-21. |
| [35] | Beattie WD, Clancey PT. Effects of Mysis relicta on the zooplankton community and kokanee population of Flathead Lake, Montana. Mysids in fisheries: Hard lessons from headlong introductions. Am. Fish S S.1991; 9: 39-48. |
| [36] | Ellis BK, Stanford JA, Goodman D, et al. Long-term effects of a trophic cascade in a large lake ecosystem. Proc Natl Acad Sci USA 2011; 108(3): 1070-5. |
| [37] | Chipps SR, Bennett DH. Zooplanktivory and nutrient regeneration by invertebrate (Mysis relicta) and vertebrate (Oncorhyncus nerka) planktivores: Implications for trophic interactions in oligotrophic lakes. Trans Am Fish Soc 2000; 129: 569-83. |
| [38] | Clarke LR, Bennett DH. Zooplankton production and planktivore consumption in Lake Pend Oreille, Idaho. Northwest Sci 2007; 81: 215-23. |
| [39] | Caldwell TJ, Wilhelm FM, Dux A. Non-native pelagic macroinvertebrate alters population dynamics of herbivorous zooplankton in a large deep lake. Can J Fish Aquat Sci 2016; 73: 832-43. |
| [40] | Whall J, Lasenby D. Comparison of the trophic role of the freshwater shrimp Mysis relicta in two Okanagan Valley lakes, British Columbia. Okanagan Lake Action Plan Year 1 (1996-97) and Year 2 (1997-98). Fisheries Project Report No. RD 73. Fisheries Management Branch, Ministry of Fisheries, Province of British Columbia 1998. |
| [41] | Smokorowski KE. The response of the freshwater shrimp, Mysis relicta, to the partial fertilization of Kootenay Lake, British Columbia. PhD thesis Trent University 1998. Peterborough, Ontario:: Trent University 1998. |
| [42] | Thompson LC. Abundance and production of zooplankton and kokanee salmon (Oncorhyncus nerka) in Kootenay Lake, British Columbia during artificial fertilization. PhD Thesis 1999. |
| [43] | Cooper KL. Interactions among Neomysis mercedis populations, zooplankton community structure, and lake fertilization. MSc. thesis. Burnaby 1988. |
| [44] | Cooper KL, Hyatt KD, Rankin DP. Life history and production of Neomysis mercedis in two British Columbia lakes. Hydrobiologia 1992; 230: 9-30. |
| [45] | Kitchell JF, Koonce JF, O’Neill RV, Shugart HH Jr, Magnuson JJ, Booth RS. Model of fish biomass dynamics. Trans Am Fish Soc 1974; 103: 786-98. |
| [46] | Rudstam LG. A bioenergetic model for Mysis growth and consumption applied to a Baltic population of Mysis mixta. J Plankton Res 1989; 11: 971-83. |
| [47] | Hyatt KD, McQueen DJ, Rankin DP, et al. Methods and summary data for limnology and food-web structure in Osoyoos. Lake, B C (2005-2013); Revised Can Dat Rep Fish Aquat Sci No 1274 2017; 73. Available from: http:// waves-vagues.dfo-mpo.gc.ca/ Library/ 40599577.pdf |
| [48] | Fryer JK. Columbia Basin Sockeye Salmon: Causes of their past decline, factors contributing to their present low abundance, and future outlook. PhD thesis. Seattle: University of Washington 1995. Washington: University of Washington 1995. |
| [49] | Allen RL, Meekin TK. Columbia River Sockeye Salmon study, 1971-1974. Wash Dep Fish Prog Rep 1980; 120-75. |
| [50] | Northcote TG, Halsey TG, MacDonald SJ. Fisheries and indicators of water quality in Okanagan Basin lakes, British Columbia Preliminary Report no 22 Canada British Columbia - Okanagan Basin Agreement 1972. |
| [51] | COBTWG. State of fish and fish habitat in the Okanagan and Similkameen Basins. Canadian Okanagan basin technical working group (COBTWG). 2004. Available from: http:// www.obwb.ca/ fileadmin/ docs/ state_of_fish_habitat_obwb.pdf |
| [52] | Borgmann U, Shear H, Moore J. Zooplankton and potential fish production in Lake Ontario. Can J Fish Aquat Sci 1984; 41: 1303-9. |
| [53] | Cooley JM, Moore JE, Geiling WT. Population dynamics, biomass, and production of the macrozooplankton in the Bay of Quinte during changes in phosphorus loading. Project Quinte: Point source phosphorus control and ecosystems response in the Bay of Quinte, Lake Ontario. Can Spec Pub Fish Aquat Sci.1986. |
| [54] | Paloheimo JE. Calculation of instantaneous birth rate 1. Limnol Oceanogr 1974; 19: 692-4. |
| [55] | Cusson M, Plante JF, Genest C. Effect of different sampling designs and methods on the estimation of secondary production: A simulation. Limnol Oceanogr Methods 2006; 4: 38-48. |
| [56] | Krueger CC, Martin FB. Computation of confidence intervals for the size-frequency (Hynes) method of estimating secondary production. Limnol Oceanogr 1980; 25(4): 773-7. |
| [57] | Waters TF, Crawford GW. Annual production of a stream mayfly population: A comparison of methods. Limnol Oceanogr 1973; 18(2): 286-96. |
| [58] | Morin A, Mousseau TA, Roff DA. Accuracy and precision of secondary production estimates. Limnol Oceanogr 1987; 32(6): 1342-52. |
| [59] | Johannsson O. Life history and productivity of Mysis relicta in Lake Ontario. J Great Lakes Res 1992; 18: 154-68. |
| [60] | Hanson PC, Johnson TB, Schindler DE, et al. Fish Bioenergetics 3.0. University of Wisconsin-Madison Centre for Limnology and University of Wisconsin Sea Grant Institute 1997. |
| [61] | Enzenhofer HJ, Hume JMB. Simple closing midwater trawl for small boats. N Am J Fish Manage 1989; 9: 372-7. |
| [62] | Hyatt KD, Stockner JG. Responses of Sockeye Salmon (Oncorhynchus nerka) to fertilization of British Columbia coastal lakes. Can J Fish Aquat Sci 1985; 42: 320-31. |
| [63] | Gjernes TW, Hyatt KD, Rankin DP. Development of specifications for the use of an uncalibrated echo sounder to estimate populations of small limnetic fish. Can Tec Rep Fish Aquat Sci 1509 1986. |
| [64] | MacLennan DN, Simmonds EJ. Fisheries Acoustics. Fish and Fisheries Ser London1992. |
| [65] | Hyatt KD, Rankin DP, Hanslit B. Acoustic and trawl based estimates of juvenile Sockeye Salmon (Oncorhynchus nerka) production from 1976-1999 brood year adults returning to Smith Inlet and Long Lake, British Columbia. Pacific Stock Assessment Review Committee Working Paper S00-21 2000. |
| [66] | Parkinson EA, Rieman BE, Rudstam LG. Comparison of acoustic and trawl methods for estimating density and age composition of kokanee. Trans Am Fish Soc 1994; 123: 841-54. |
| [67] | Alexander CAD, Hyatt KD. Proceedings of the peer review workshop for the Okanagan Sockeye re-introduction experiment, final draft. Summary report to the Okanagan Nation Alliance and Canadian Okanagan Basin Technical Working Group. 2015.125 p. Available from the Okanagan Nation Alliance, 101-3535 Old Okanagan Highway, Westbank, BC. V4T 3L7. |
| [68] | Hulbert S. Pseudoreplication and the design of ecological field experiments. Ecol Monogr 1984; 54: 187-211. |
| [69] | Millar RB, Anderson MJ. Remedies for pseudoreplication. Fish Res 2004; 70: 397-407. |
| [70] | Stockwell MM, Hyatt KD. A summary of Okanagan Sockeye Salmon (Oncorhynchus nerka) escapement survey observations by date and river segment from 1947 to 2001. Can Data Rep Fish Aquat Sci 2003; 1106: 34p. [+ Data CD ROM.]. |
| [71] | Horn HS. Measurement of “overlap” in comparative ecological studies. Am Nat 1966; 914: 419-24. |
| [72] | Krebs CJ. Ecological methodology 2nd ed. 1999. |
| [73] | von Bertalanffy L. A quantitative theory of organic growth (Enquiries on growth laws. II). Hum Biol 1938; 10(2): 181-213. |
| [74] | Hilborn R, Walters CJ. Quantitative Fisheries Stock Assessment, Choice, Dynamics and Uncertainty 1992. |
| [75] | R Core Team. A language and environment for statistical computing. R Foundation for Statistical Computing, Vienna, Austria 2015. Version 3.1.3. Available from http://www.R-project.org |
| [76] | Sparre P, Venema SC. Introduction to tropical fish stock management. Part 1. Manual. FAO Technical Paper. 306(1) Rev 2. 1998. Available from http://www.fao.org/docrep/W5449e/w5449e05.htm |
| [77] | Thompson KR, Page FH. Detecting synchrony of recruitment using short, autocorrelated time series. Can J Fish Aquat Sci 1989; 46: 1831-8. |
| [78] | Pyper BJ, Peterman RM. Comparison of methods to account for autocorrelation in correlation analyses of fish data. Can J Fish Aquat Sci 1998; 55: 2127-40. |
| [79] | Box GEB, Jenkins GW. Time series analysis: forecasting and control Revised ed. 1976. |
| [80] | Cyr H. Cladoceran and copepod-dominated zooplankton communities graze at similar rates in low-productivity lakes. Can J Fish Aquat Sci 1998; 55: 414-22. |
| [81] | Cottingham KL. Nutrients and zooplankton as multiple stressors on phytoplankton communities: evidence from size structure. Limnol Oceanogr 1999; 44: 810-27. |
| [82] | Schultz PC, Folt CL. Food resources, survivorship, and reproduction of the omnivorous calanoid copepod Epischura lacustris. Ecol 1990; 71: 2224-40. |
| [83] | Tannant DW, Skermer N. Mud and debris flows and associated earth dam failures in the Okanagan region of British Columbia. Can Geotech J 2013; 50: 820-33. |
| [84] | Summit. Surface water hydrology and hydrologic modelling study “state of the basin” report. Final report prepared for the Okanagan Basin Water Board by Summit Environmental Consultants Ltd., Vernon, BC 2009. Available from: www.obwb.ca |
| [85] | Chess DW, Stanford JA. Comparative energetics and life cycle of the oppossum shrimp (Mysis relicta) in native and non-native environments. Freshw Biol 1998; 40(4): 783-94. |
| [86] | Hyatt KD, McQueen DJ, Rankin DP, et al. Methods and summary data for limnology and food-web structure in Skaha Lake, B. C. (2005-2013); Revised. Can Dat Rep Fish Aquat Sci No.1275, 2017; 77p. Available from: http://waves-vagues. dfo-mpo.gc.ca/ Library/ 40599619.pdf |
| [87] | Schoen ER, Beauchamp DA, Buettner AR, Overman NC. Temperature and depth mediate resource competition and apparent competition between Mysis diluviana and kokanee. Ecol Appl 2015; 25(7): 1962-75. |
| [88] | Lasenby DC, Northcote TG, Furst M. Theory, practice, and effects of Mysis relicta introductions to North American and Scandinavian lakes. Can J Fish Aquat Sci 1986; 43(6): 1277-84. |
| [89] | Hyatt KD, Stockwell MM. Krueger C, et al. Chasing an illusion? Successful restoration of Okanagan River Sockeye Salmon (Oncorhynchus nerka) in a sea of uncertainty. From Catastrophe to Recovery: Stories of Fish Management Success Am Fish S S 2018. |