
RESEARCH ARTICLE
When Do Mountain Whitefish (Prosopium williamsoni) Spawn? A Comparison of Estimates Based on Gonadosomatic Indices and Spawner and Egg Counts
Robyn L. Irvine1, *, Joseph L. Thorley1, Louise Porto2
Article Information

Identifiers and Pagination:
Year: 2017Volume: 10
First Page: 12
Last Page: 22
Publisher Id: TOFISHSJ-10-12
DOI: 10.2174/1874401X01710010012
Article History:
Received Date: 10/09/2016Revision Received Date: 22/11/2016
Acceptance Date: 30/11/2016
Electronic publication date: 31/03/2017
Collection year: 2017
open-access license: This is an open access article distributed under the terms of the Creative Commons Attribution 4.0 International Public License (CC-BY 4.0), a copy of which is available at: (https://creativecommons.org/licenses/by/4.0/legalcode). This license permits unrestricted use, distribution, and reproduction in any medium, provided the original author and source are credited.
Abstract
Determining when fish spawn has major implications for effective fisheries management, particularly in dam-controlled rivers where reproductive potential may be affected by an altered hydrograph. Three methods for estimating spawn timing in riverine broadcast spawners were compared for their precision, effort and potential impact on a population of Mountain Whitefish in the regulated Lower Duncan River, Canada. The first method is based on the Gonadosomatic Index (GSI), which is a measure of the relative mass of an individual’s gonads. The second method is based on counts of aggregating adults, while the third method is based on passive egg collection using egg mats. Analysis of the GSI data provided the most precise estimates. It estimated that spawning occurred between October 30th and November 26th in 2010 and between November 8th and November 27th in 2011. Collection of GSI data required moderate effort and had some impact due to the need for lethal harvest. Analysis of the spawner counts using a simple Bayesian Area-Under-the-Curve model provided less precise estimates of spawn timing but the method likely had negligible impact on the population and required only moderate effort. Deployment of egg mats required high effort and collected insufficient information to derive statistical estimates of spawn timing. We discuss how information from different methods could be combined together into a single integrated model to maximize the precision while minimizing the effort and impact.
INTRODUCTION
Effective management of fish populations requires reliable estimates of the timing of key life history events [1]. This is particularly important in regulated rivers where changes in operations can influence both the timing of events and the subsequent survival. For example, the match/mismatch hypothesis states that even small phenological shifts in emergence timing can have large consequences for subsequent recruitment [2]. As changes to a river's thermal and hydrological regime can alter when fish spawn, how long eggs incubate and the environmental conditions pre- and post-emergence, the potential for flow regulation to impact fish populations is profound. However, reliable estimates of spawn timing can sometimes allow operations to be temporally tailored to mitigate the impacts [3].
Mountain Whitefish (Prosopium williamsoni) are an endemic fish (Family Salmonidae, Subfamily Coregoninae) to western North America and an important component of many western riverine ecosystems through their roles as invertebrate consumers and prey for large piscivores. Historically, Mountain Whitefish have not been as extensively studied as other native western salmonids, perhaps due to their lack of popularity as a sport fish and their perceived robust abundance [4]. However, more recent investigations on Mountain Whitefish have illustrated their sensitivity to changes in lotic environments from impoundment [5] and highlighted significant declines in at least some parts of their range [6, 7]. Causal mechanisms for the declining Mountain Whitefish populations remain unknown but are coincident with modified water flows, increased water temperatures, altered disease incidence and increased anthropogenic disturbances [5-7].
Mountain Whitefish are fall broadcast spawners [8, 9]. They usually spawn when temperatures drop below 10°C and exhibit peak spawning behaviour at temperatures less than 6°C [10, 11]. Not surprisingly, Mountain Whitefish populations in cooler environments tend to spawn earlier. For example, in Sheep Creek, Alberta, which is a high elevational stream in the Rocky Mountains, individuals spawn as early as late September [10]. Similarly in Utah, Mountain Whitefish spawn in the high elevation Blacks Fork River from mid-October to mid-November but spawn in the lower elevation Logan River during late November and early December [12]. In the lower Columbia River below Hugh L. Keenleyside Dam, which experiences elevated winter water temperatures due to a large upstream reservoir, Mountain Whitefish are still spawning as late as mid-February [13].
The Lower Duncan River is a dam-headed system in southern British Columbia, Canada. Its temperature and flow regimes have been altered by the storage of water in the upstream Duncan Reservoir [14]. Earlier intensive egg mat studies had indicated that Mountain Whitefish in the Lower Duncan River spawn between September and December [15]. The current study was conducted to refine the spawn timing estimates and provided an opportunity to compare three different approaches.
Relative gonadal mass, counts of fish aggregations [16] and passive egg collection [17] all provide information about spawn timing in broadcast spawners. The Gonadosomatic Index (GSI) is a macroscopic measure of gonadal development that requires lethal sampling. It provides information on the accumulation and release of gametes. Fish aggregation counts provide information on the accumulation and dissipation of spawners while passive egg collection using mats or nets provide information on the temporal distribution of eggs in the water column.
To the best of our knowledge, the precision of spawn-timing estimates derived using the three different approaches has not been previously compared. We compare the three methods based on their precision, effort and potential for population-level impact. We also discuss how information from different methods could be combined together into a single integrated model to maximize the precision and accuracy while minimizing the effort and impact.
METHODS
Study Area
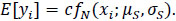
The Lower Duncan River is a hydroelectric, dam-headed system (Latitude: 50.25 Longitude: -116.95) that flows for 12.5 km below the BC Hydro operated Duncan Dam before entering the north end of Kootenay Lake (Fig. 1) in southern British Columbia (BC), Canada. Supplementary Map S1 is a kml file of the egg mat locations with their river kilometres so that the field site can be placed in a global context. The Duncan River's flows are augmented 1.1 km downstream of Duncan Dam by the Lardeau River (Fig. 1), a major tributary that follows a natural hydrograph. The Duncan River drains an area of 2,443 km2 and is part of the Columbia River basin via its role as a major tributary to Kootenay Lake, which in turn flows into the Kootenay River and then into the Columbia River at Castlegar, BC. The Duncan River provides habitat for Mountain Whitefish, Kokanee (Oncorhynchus nerka), Bull Trout (Salvelinus confluentus), Rainbow Trout (Oncorhychus mykiss), Burbot (Lota lota) as well as several forage fish species.
Field Data Collection
The field component of the current study was conducted in 2010 and 2011. Based on the findings of an earlier egg-mat study [15], field data were collected between September and December.
Fish Capture
Mountain Whitefish were captured for gonadal extraction by angling in 2010 and 2011 and boat electrofishing in 2011. Boat electrofishing was conducted in an upstream direction with the boat operator slowly orienting the front of the boat where two netters positioned themselves to capture fish. One of the two netters was in control of a foot switch that powered the unit on. If Bull Trout, a provincially Blue Listed species, were observed during boat electrofishing, the power to the electrofisher was cut until the fish was out of range. Netted fish were immediately placed in a live well that contained fresh river water. Once electrofishing was completed, fish were sorted, measured and euthanised as applicable. The boat electrofishing unit was a Smith-Root 7.5 Gas-Powered Pulsator (GPP) set to a frequency of 20 Hz, a duty cycle of 10% and a voltage between 320 and 500V depending upon the conductivity. When angling, fish were caught using beadhead flies or salmon roe on fly rods. Captured fish were either immediately released or immediately euthanised. In 2010, all captured fish were retained in order to determine the size at maturity by sex. In 2011, fish that were shorter than the maturity threshold and in good condition were released. All successful fish collection dates are indicated in Fig. (2).
 |
Fig. (1). Map of the Lower Duncan River, British Columbia. The egg mat locations sampled in 2010 are indicated by black circles. The red triangles indicate the start and end of the spawner survey site. Duncan Dam is located between Duncan Reservoir and the Lower Duncan River. The projection is BC Albers (EPSG:3153). The axes provide the scale and orientation. Map data under Open Government License - British Columbia. |
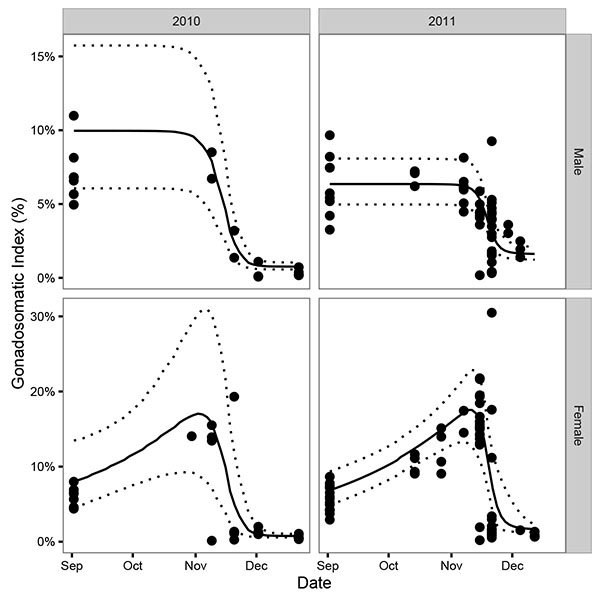 |
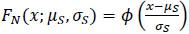
Fig. (2). Gonadosomatic indices for Mountain Whitefish in the Lower Duncan River, British Columbia, by date, year and sex. The points are the observed values, the solid line is the expected value and the dotted lines are the 95% credible intervals. |
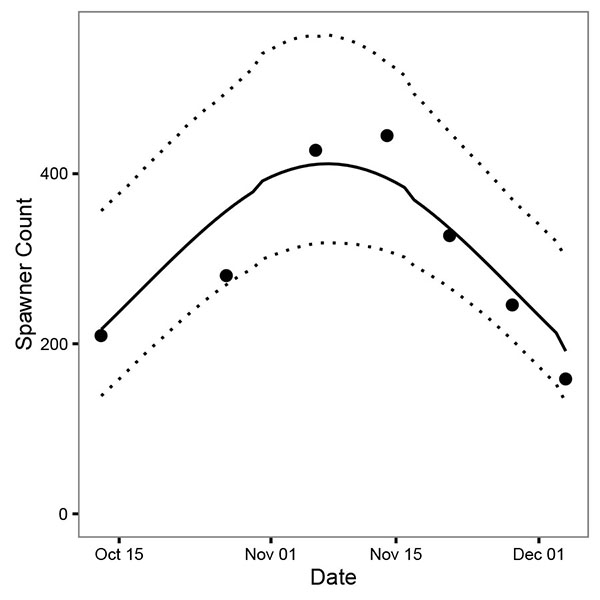 |
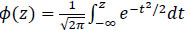
Fig. (3). Estimated spawn timing of Mountain Whitefish in the Lower Duncan River, British Columbia, by year, date and spawn timing model. The points are the expected values and the dashed lines are the 95% credible intervals. |
Spawner Counts
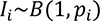
Spawner surveys were done one hour after sunset by three observers with spotlights from a jet boat (two on the bow and one on the stern). Crew members recorded the spatial location and estimated size (number of fish) of each Mountain Whitefish aggregation observed. During the surveys the crew members regularly communicated to avoid double-counting. To minimize observer effects, two of the crew members were consistent throughout the study. In 2010, multiple locations were surveyed to determine where fish were consistently observed. In 2011, the stretch of mainstem river between 1.5 and 2.5 km downstream of Duncan Dam on the river left was surveyed on each visit as an index site (Fig. 1). The 2011 fish survey dates are plotted in Fig. (3).
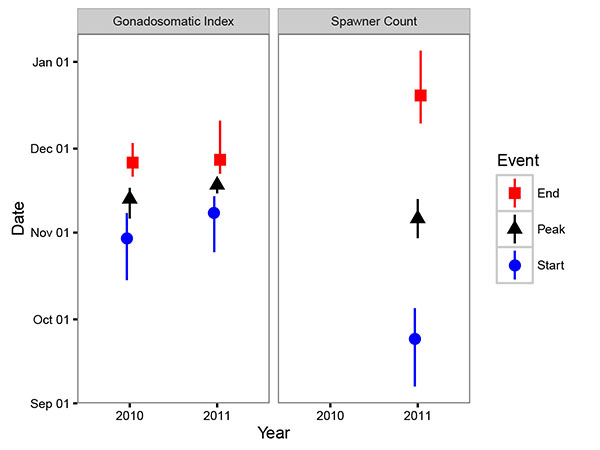 |
Fig. (4). Spawner counts for Mountain Whitefish in the Lower Duncan River, British Columbia, in 2011 by date. The points are the observed values, the solid line is the expected value and the dotted lines are the 95% credible intervals. |
Egg Mats
Twelve egg mats were deployed on October 29th, 2010 at separate locations throughout the river (Fig. 1). The twelve locations were either the site of historical egg collection [15] and/or were associated with the presence of adult Mountain Whitefish. The egg mats were made of synthetic latex coated hogshair (furnace filter material) between an angle iron frame (0.91 m by 0.76 m) and were anchored on the substrate with upstream anchoring plates. Filter material was present on both sides of the iron frame, so that the hogshair would face upward to capture eggs drifting in the water column when deployed to the river bottom. The mats were pulled and examined for eggs every six to 11 days until they were removed on December 28th, 2010 after two consecutive surveys produced no eggs (Table 1). A single mat was displaced downriver during the final deployment period. As it was filled with gravel from its downstream movement and the hogshair was not exposed, it was not considered to have fished for the final six day period. Due to the extremely low catch rate, egg mats were not deployed in 2011.
| Date | Mats | Days | Eggs |
|---|---|---|---|
| Oct 30 | 12 | 10 | 0 |
| Nov 9 | 12 | 11 | 3 |
| Nov 20 | 12 | 10 | 1 |
| Nov 30 | 12 | 6 | 0 |
| Dec 6 | 12 | 8 | 1 |
| Dec 14 | 12 | 8 | 0 |
| Dec 22 | 11 | 6 | 0 |
Permitting and Access
Fish were obtained under scientific collection permit (No. CB10-65202) issued by the British Columbia Ministry of Forests Lands and Natural Resource Operations (MFLNRO). The study area was located on publicly accessible Crown land.
Fish Biometrics
Fish were processed in the lab within 12 hours of capture. Each fish was measured (fork length ± 1 mm) and weighed (± 0.1 g). Following dissection the weight of the stomach contents (± 0.1 g) and gonads (± 0.1 g) as well as the individual's sex were also recorded. Fish with no substantive gonadal development were categorized as immature [18] and excluded from the GSI analysis.
Data Preparation
Data was recorded on datasheets before being entered into custom spreadsheets and then imported into an Access database. Thirty percent of the data were manually checked for data entry errors. Data from the Access database were manipulated using R version 3.3.0 [19] and bundled together in the R data package mwstdatr [20].
Gonadosomatic Index Data
GSI is a unitless measure of gonadal development. It is unitless because it divides the wet mass of the gonads (Ωg) by the total wet body mass (Ωb) minus the wet mass of the stomach contents (Ωs) to produce a proportion (or percent).
 |
(1) |
Statistical Analysis
Based upon knowledge of life history and preliminary plotting exercises, the GSI data were analysed using a spawn timing model in which females spawned only once while males spawned multiple times. The spawner count data were analysed using a simple Area-Under-the-Curve (AUC) model [21] in which efficiency and residence time were combined into a single scaling parameter. There were insufficient eggs collected to model spawn timing from the egg mat data.
Model Structure
The spawn timing models for both the GSI and spawner count data assumed that the frequency of spawning was normally distributed (N(μS, σS)), i.e., spawning gradually increased through time to a single peak before decreasing at the same rate. The spawner count model assumed that the expected count on the xth day of the year followed the resultant normal probability density function,
 |
(2) |
multiplied by a positive scaling constant c
 |
(3) |
In contrast, the GSI model assumed that the expected GSI value for males declined from pre-spawning (βM) to post-spawning levels (α) following the the corresponding normal cumulative density function,
 |
(4) |
where,
 |
(5) |
such that the expectation for the ith male was,
 |
(6) |
with  defining the day of capture. In effect, the model assumed that each male released their milt in multiple spawning events.
For the ith female the model assumed that the expected GSI value was Bernoulli distributed (B(1, pi)) between an increasing pre-spawning level and the post-spawning level so that
 |
(7) |
where
 |
(8) |
and
 |
(9) |
In other words, the GSI spawn-timing model assumed that each female released their eggs in a single event.
In both the spawner and GSI models, a bias-corrected [22] log-normal distribution was assumed for the residual errors, the day of the year was centered prior to fitting and each year of available data was analysed separately.
The start (α), peak (κ) and end (ω) of spawning were defined to be when 2.5%, 50% and 97.5% of spawning had occurred, respectively. Each estimate has associated lower and upper 95% credible limits, i.e., αl and αu. The uncertainty in the spawn timing estimates was quantified in terms of both the interval between the start and end of spawning (Δ=ω-α), and the mean uncertainty in the estimates
 |
Parameter Estimation
The spawn timing models, which were fitted within a Bayesian framework, assumed vague uniform and normal prior distributions [23]. The posterior distributions were estimated using a Monte Carlo Markov Chain (MCMC) algorithm. To guard against non-convergence of the MCMC process, five chains were run, starting at randomly selected initial values. Each chain was run for at least 10,000 iterations with the first half of the chain discarded for burn-in followed by further thinning to leave a minimum of 2,000 samples from each chain. The reported expected values are the means of the posterior distributions and the 95% credible intervals (CRIs) are the 2.5% and 97.5% quantiles [24].
Model Checking
Model convergence was confirmed by visually inspecting the MCMC chain traces and by ensuring that the Brooks-Gelman-Rubin convergence diagnostic  for each of the parameters in the model [23, 25]. The vagueness of the priors was checked by visually comparing the shape and range of the resultant posterior distributions to their respective prior distributions. Model adequacy was validated by visual examination of the residual variation.
Results
Catch-Per-Unit-Effort
The mean angling Catch-Per-Unit-Effort (CPUE) was 1.28 fish.rod-1.hr-1. The CPUE for boat electrofishing was 27.7 fish.boat-1.hr-1. The collection of five eggs represented a CPUE of just 0.000297 eggs.mat-1.hr-1 (Table 1).
GSI
A total of 49 and 117 mature Mountain Whitefish were captured by angling or boat electrofishing in 2010 and 2011, respectively (Fig. 2). Based on the 2010 dissections, the maturity threshold was defined to be 230 mm. In both years, males and females exhibited a clear decline in the GSI in November (Fig. 2). Consistent with the model's assumptions, female GSI increased through the pre-spawning period while male GSI remained at a constant level.
The estimated interval between the start and end of spawning was relatively short (Δ = 23 days) while the average uncertainty in the estimates (Θ) was 15 days. The GSI model estimated that in 2010 spawning began on October 30th (95% CRI October 15th - November 8th), peaked on November 13th (95% CRI November 6th - November 17th) and ended on November 26th (95% CRI November 21st - December 3rd) (Fig. 4) and that in 2011 it began on November 8th (95% CRI October 25th - November 14th), peaked on November 18th (95% CRI November 15th - November 20th) and ended on November 27th (95% CRI November 22nd - December 11th) (Fig. 4).
Spawner Counts
The peak count of 445 fish was recorded on November 14th, 2011 (Fig. 3). Compared to the estimates from GSI, the timing of spawning based on the spawner count data was much more protracted (Δ = 87 days) and the estimates less certain (θ = 23 days). The spawner count model estimated that in 2011 spawning commenced on September 24th (95% CRI September 7th - October 5th), peaked on November 6th (95% CRI October 30th - November 13th) and ended on December 20th (95% CRI December 10th - January 5th) (Fig. 4).
DISCUSSION
Methods for estimating spawn timing can be evaluated by looking at three factors: 1) the precision of their estimates, 2) the effort required to implement them, and 3) the impact of the method on the population. In the current study, the GSI-based approach provided the most precise estimates, took more effort than the spawner counts and less effort than the egg collection and had a high potential for impact on the population due to the required lethal sampling. The repeated adult spawner count method was less precise than the GSI approach but more precise than the egg mat method (i.e., sufficient data were collected from the adult counts to fit a model). Spawner counts took less effort than the egg mats and had less impact on the population than the GSI. The passive egg collection method using mats required the highest amount of effort, impacted five eggs, and provided insufficient data for analysis.
Although the GSI and spawner count models produced similar peak spawn timing estimates, the estimated duration of spawning was more protracted in the spawner count model: the GSI model estimated that spawning took 27 days in 2010 and 19 days in 2011 whereas the spawner count model estimated that in 2011 it took 87 days. There are at least two reasons for the spawner count model's high Δ value. The first, and perhaps most important, is that fish begin aggregating prior to spawning so that initial increases and (possibly later decreases) in spawner counts are decoupled from spawning. Egg collection also suffers from decoupling in the sense that eggs drifting in the water column may be the product of earlier spawning events particularly following a flow increase. On the Lower Columbia River, a minimum of 12% of the eggs captured by mats were from earlier spawning events [17]. In the case of egg mats, the problem can be at least partly avoided by aging eggs based on their developmental stage. The second reason for the high Δ value is that each spawner count survey represents a single data point (n = 7). In contrast each mature fish in the GSI model contributes a data point (n = 49 in 2010 and n = 117 in 2011).
In the current study, the impact of the spawner counts and egg collection on the population were likely negligible. Although boat activity could conceivably cause spawners to move to less suitable habitat or in the case of extreme stress reabsorb their eggs, the only empirically observable impact of the boat counts was a slight disruption of the spawning activities. Similarly, the impact of the loss of five eggs on a broadcast spawner like Mountain Whitefish, which has evolved to release large numbers of eggs with a concomitant high mortality rate, is almost zero.
It is worth noting that for the same effort, the population-level impact of a GSI-based study increases with declining abundance but remains constant for spawner count and egg-mat based studies, i.e., GSI involves the dissection of the same number of fish irrespective of population status while spawner survey and egg collection disturb or collect the same proportion of the population. A corollary of this is that egg mat-based studies provide more precise estimates at higher abundance.
Gonadosomatic indices have been used on a diversity of different fish species [1] in a wide range of studies to infer spawn timing [1, 28] and duration [29] as well as the probability of an individual spawning [30]. GSI has also been used to quantify impoundment effects [3], the seasonality of a mixed stock [31], to differentiate spatial variance in spawn timing of stocks [32] and to determine the effects of photoperiod and temperature on coregonid gonad maturation [33]. The current study contributes to the modelling literature through the development of a single spawn-timing model that accounts for sex-specific differences in GSI patterns across the spawning period.
In the reproductive biology literature, GSI is often compared for accuracy and assessed for its ability to answer questions of timing in relation to microscopic techniques (e.g., histological assessment) [34-36]. The repeatedly expressed challenge is that while histology is the most accurate approach to determining spawn timing, it requires the most resources and is therefore not always possible. Another identified challenge in the field of reproductive biology is the need for better conceptual and quantitative models [37]. These two problems of microscopic vs. macroscopic techniques and the need for improved modelling are not necessarily separate. In a broader ecological context, the question becomes one of optimizing field methods, lab approaches and analyses to reflect accurately the spawn timing.
Integrated models provide estimates based on the information in different datasets [38]. They are of interest in the current context because they would allow all the available information to be incorporated into a single model. Like recent integrated population models [39], integrated spawn timing models would be state-space models [40] in the sense that they would account for the fact that processes like drifting eggs and aggregating spawners that are partly decoupled from actual spawning by explictly modelling them. As a result, integrated spawn timing models would not only provide the most reliable estimates but would also allow different methods to be used in different years depending on the required precision, available budget and population status.
In a broader context, integrated spawn timing models provide a conceptual and analytic framework to better understand spawning events over time [37], and incorporate information from microscopic studies such as histological assessments [34-36]. Perhaps most intriguingly of all they suggest the possibility of developing models that explain and predict the timing of key reproductive events on lifetime, annual, seasonal and diel cycles.
In conclusion, the GSI-based approach required moderate effort and had some impact on the population but provided the most precise estimates. Spawner counts also required moderate effort and likely had negligible impact but provided less precise estimates. Egg mats were labour intensive and had negligible impact on the population but provided insufficient information to estimate spawn timing. Integrated spawn-timing models provide a framework to better understand spawn-timing and maximize precision while minimizing effort and impact.
FUNDING STATEMENT
The project was funded by BC Hydro. The funders had no role in study design, data collection and analysis, decision to publish, or preparation of the manuscript.
AUTHOR CONTRIBUTION
• Robyn L. Irvine conceived and designed the experiments, performed the experiments, analyzed the data, wrote the paper and reviewed drafts of the paper.
• Joseph L. Thorley analyzed the data, wrote the paper, prepared figures and/or tables and reviewed drafts of the paper.
• Louise Porto conceived and designed the experiments, performed the experiments, wrote the paper and reviewed drafts of the paper.
DATA AVAILABILITY
The data are available as the mwstdatr R package [20] from https://doi.org/10.5281/zenodo.167601. The software is available as the mwst2 R package [27] from https://doi.org/10.5281/zenodo.167611.
SUPPLEMENTARY MATERIAL
Map S1 Egg mat locations with their river kilometres (kml).
Article S1 Instructions on how to install the software and replicate the analyses (pdf).
CONFLICT OF INTEREST
The authors provide independent analytic services for a wide variety of government agencies, corporations and conservation organizations on a range of different species and issues.
ACKNOWLEDGEMENTS
We thank BC Hydro for funding the study and G. Martel, T. Oussoren and A. Leake for their support. We also thank J.T.A. Baxter, C. Tarala, C. Lawrence, J. Clarricoates, M. Thomas and G. Andrusak for contributing to data collection through the winter months. Finally, we thank the staff of Duncan Dam (C. Wiens, L. Wiens, R. Greenlaw) for providing safety communication.
REFERENCES
| [1] | Tsikliras AC, Antonopoulou E, Stergiou KI. Spawning period of Mediterranean marine, fishes. Rev Fish Biol Fish 2010; 20(4): 499-538. |
| [2] | Cushing D. Plankton production and year-class strength in fish populations: an update of the match/mismatch hypothesis. Adv Mar Biol 1990; 26: 249-92. |
| [3] | McAdam DS, Liley NR, Tan ES. Comparison of reproductive indicators and analysis of the reproductive seasonality of the tinfoil barb, Puntius schwanenfeldii, in the Perak River, Malaysia. Environ Biol Fishes 1999; 55(4): 369-80. |
| [4] | Benjamin JR, Wetzel LA, Martens KD, Larsen K, Connolly PJ. Spatio-temporal variability in movement, age, and growth of mountain whitefish (Prosopium williamsoni) in a river network based upon PIT tagging and otolith chemistry. Can J Fish Aquat Sci 2014; 71(1): 131-40. |
| [5] | Paragamian V. Changes in the species composition of the fish community in a reach of the Kootenai River, Idaho, after construction of Libby Dam. J Freshwat Ecol 2002; 17(3): 375-83. |
| [6] | Schisler GJ. Effects of Whirling Disease, Myxobolus Cerebralis, Exposure on Juvenile Mountain Whitefish, Prosopium Williamsoni. Fort Collins: Colorado Division of Wildlife, Aquatic Research Section 2010. |
| [7] | Brinkman SF, Crockett HJ, Rogers KB. Upper thermal tolerance of Mountain Whitefish eggs and fry. Trans Am Fish Soc 2013; 142(3): 824-31. |
| [8] | Pettit SW, Wallace RL. Age, growth, and movement of Mountain Whitefish, Prosopium williamsoni (Girard), in the North Fork Clearwater River, Idaho. Trans Am Fish Soc 1975; 104(1): 68-76. |
| [9] | McPhail J, Troffe P. The Mountain Whitefish (Prosopium williamsoni). In: A potential indicator species for the Fraser System Technical Report, Vancouver, BC 1998. |
| [10] | Thompson GE, Davies RW. Observations on the age, growth, reproduction, and feeding of mountain whitefish (prosopium williamsoni) in the sheep river, Alberta. Trans Am Fish Soc 1976; 105(2): 208-19. |
| [11] | Northcote T, Ennis G. Mountain whitefish biology and habitat use in relation to compensation and improvement possiblities. Rev Fish Sci 1994; 2: 347-71. |
| [12] | Wydoski RS. Life history and fecundity of mountain whitefish from Utah Streams. Trans Am Fish Soc 2001; 130(4): 692-8. |
| [13] | Hildebrand B. CLBMON-48 - Lower Columbia River Whitefish life history and egg mat monitoring program: Year 5 interpretive report A golder Associates Ltd Report prepared for BC Hydro 11-1492-0111F. Castlegar, BC: BC Hydro 2014. |
| [14] | Lawrence C, Irvine R, Porto L. DDMMON-7: Duncan dam projectwater use plan lower duncan river water quality monitoring, year 2 synthesis report An AMEC earth & environmental ltd and poisson consulting ltd report. Nelson, BC: BC Hydro 2012. |
| [15] | Baxter J. Mountain whitefish studies in the Lower Duncan River 2003-2005: Preliminary Data Analysis Technical report. Castlegar, BC: BC Hydro 2007. |
| [16] | Hilborn R, Bue BG, Sharr S. Estimating spawning escapements from periodic counts: A comparison of methods. Can J Fish Aquat Sci 1991; 56(5): 888-96. |
| [17] | Hildebrand B. CLBMON #48 - Lower Columbia River Whitefish life History and egg mat monitoring program: Year 2 Data Report Technical report. Castlegar, BC: For BC Hydro 2010. |
| [18] | Ricker W, Ed. Methods for assessment of fish production in fresh waters. USA: Blackwell Series 1968. |
| [19] | R Core Team.. R: A language and environment for statistical computing. Vienna, Austria: R Foundation for Statistical Computing 2015. Available from: https://www.R-project.org/ |
| [20] | Thorley J, Irvine R, Porto L. mwstdatr: Mountain whitefish spawn timing data. R package version 0.0.2, 2016. |
| [21] | Parken CK, Bailey RE, Irvine JR. Incorporating uncertainty into area-under-the-curve and peak count salmon escapement estimation. N Am J Fish Manage 2003; 23(1): 78-90. |
| [22] | Sprugel DG. Correcting for bias in log-transformed allometric equations. Ecology 1983; 64(1): 209. |
| [23] | Kéry M, Schaub M. Bayesian population analysis using WinBUGS: A hierarchical perspective. Boston: Academic Press 2011. |
| [24] | Gelman A. Bayesian data analysis. 3rd ed. Boca Raton: Chapman & Hall/CRC texts in statistical science. CRC Press 2014. |
| [25] | Brooks S, Gelman A. General methods for monitoring convergence of iterative simulations. J Comput Graph Stat 1998; 7(4): 434-55. |
| [26] | Plummer M. JAGS: a program for analysis of Bayesian graphical models using Gibbs sampling. In: Hornik K, Leisch F, Zeileis A, Eds. Proceedings of the 3rd International Workshop on Distributed Statistical Computing (DSC 2003). Vienna, Austria: Technical University of Vienna 2003. |
| [27] | Thorley J. mwst2. Mountain Whitefish spawn timing. R package version 0.0.5, 2016. Available from: https://github.com/ poissonconsulting.mwst2 |
| [28] | Adebiye FA. The sex ratio, gonadosomatic index, stages of gonadal development and fecundity of Sompat grunt, Pomadasys jubelini (Cuvier, 1830). Pak J Zool 2013; 45(1): 41-6. |
| [29] | McPherson LR, Ganias K, Marshall CT. Inaccuracies in routinely collected Atlantic herring (Clupea harengus) maturity data and correction using a gonadosomatic index model. J Mar Biol Assoc UK 2011; 91(07): 1477-87. |
| [30] | Flores A, Wiff R, Diaz E. Using the gonadosomatic index to estimate the maturity ogive: Application to Chilean hake (Merluccius gayi gayi). ICES J Mar Sci 2015; 72(2): 508-14. |
| [31] | McQuinn IH. Identification of spring-and autumn-spawning herring (Clupea harengus harengus) using maturity stages assigned from a gonadosomatic index model. Can J Fish Aquat Sci 1989; 46(6): 969-80. |
| [32] | Salvanes A, Stockley B. Spatial variation of growth and gonadal developments of Maurolicus muelleri in the Norwegian Sea and in a Norwegian fjord. Mar Biol 1996; 126: 321-32. |
| [33] | Gillet C. Egg production in a whitefish (Coregonus shinzi palea) broodstock: Effects of photoperiod on the timing of spawning and the quality of eggs. Aquat Living Resour 1991; 4: 33-9. |
| [34] | Rinchard J, Kestemont P. Comparative study of reproductive biology in single-and multiplespawner cyprinid fish. I. Morphological and histological features. J Fish Biol 1996; 49(5): 883-94. |
| [35] | Nunes C, Silva A, Soares E, Ganias K. The use of hepatic and somatic indices and histological information to characterize the reproductive dynamics of atlantic sardine sardina pilchardus from the portuguese coast. Mar Coast Fish 2011; 3(1): 127-44. |
| [36] | Brewer SK, Rabeni CF, Papoulias DM. Comparing histology and gonadosomatic index for determining spawning condition of small-bodied riverine fishes. Ecol Freshwat Fish 2008; 17(1): 54-8. |
| [37] | Lowerre-Barbieri SK, Brown-Peterson NJ, Murua H, Tomkiewicz J, Wyanski DM, Saborido-Rey F. Emerging issues and methodological advances in fisheries reproductive biology. Mar Coast Fish 2011; 3(1): 32-51. |
| [38] | Schaub M, Abadi F. Integrated population models: A novel analysis framework for deeper insights into population dynamics. J Ornithol 2011; 152(S1): 227-37. |
| [39] | Brooks SP, King R, Morgan BJ. A Bayesian approach to combining animal abundance and demographic data. Anim Biodivers Conserv 2004; 27(1): 515-29. |
| [40] | Newman K, Buckland S, Morgan B, et al. Modelling population dynamics: model formulation, fitting and assessment using state-space methods. Springer 2014. |