RESEARCH ARTICLE
Food-Web Structure and Functioning of Coastal Marine Ecosystems: Alvarado Lagoon and Adjacent Continental Shelf, Northern Gulf of Mexico
Víctor H. Cruz-Escalona1, *, María V. Morales-Zárate2, Jonathan Franco- López3, Leonardo A. Abitia-Cárdenas1, Armando Hernández-López1, Emigdio Marín-Enríquez4, Adrián F. González-Acosta1
Article Information

Identifiers and Pagination:
Year: 2018Volume: 11
First Page: 73
Last Page: 94
Publisher Id: TOFISHSJ-11-73
DOI: 10.2174/1874401X01811010073
Article History:
Received Date: 26/5/2018Revision Received Date: 5/11/2018
Acceptance Date: 13/11/2018
Electronic publication date: 31/12/2018
Collection year: 2018
open-access license: This is an open access article distributed under the terms of the Creative Commons Attribution 4.0 International Public License (CC-BY 4.0), a copy of which is available at: (https://creativecommons.org/licenses/by/4.0/legalcode). This license permits unrestricted use, distribution, and reproduction in any medium, provided the original author and source are credited.
Abstract
Introduction:
The aim of the present study was to develop a trophic model characterizing simultaneously the structure and function of the two coastal marine ecosystems: Alvarado Lagoon, Mexico and adjacent continental shelf, important area for penaeid shrimps and demersal fish species.
Method:
The model was based on the assumption of biomass balance and describes the trophic relationships, flows of energy, and transfer efficiency of the food web, and includes 66 functional groups.
Results:
Results shows that 33% of the aggregate biological community biomass comes mainly second and third trophic levels. Size of aggregate flows as well as the transfer effectiveness among groups, results like those saw in other similar works. Connectance index (CI) was 0.12, meaning that there is only 12% only of the total theoretical connections exist. Results also shows that primary producers and detritus (lagoon and shelf) contribute with 60.1% of the total ascendency. Our work can be the basis for future research, which allow us to contrast alternate hypotheses about the functioning of the system.
1. INTRODUCTION
Coastal ecosystems are highly productive, vulnerable, and particularly for tropical coasts, are greatly diverse with respect to both species and habitats. Displayed food webs highly complex, characterized for the extraordinary interchange of species from ecosystems interconnected. A noteworthy progress is the being to have recognized that both the structure and function of the trophic network are dynamic properties of the system. Food web describes species interaction and is an important part of community structure [1-5].
Currently, the assessment of what are the processes and mechanisms that determine the natural communities structure, it is an area under intense research [6-18]. Although the processes involved in regulation of communities such as predation, competition, mutualism, parasitism, etc., are long known in the field of ecology, the relative incidence of these processes in the community structure regulation, remains as hypothesis in most cases, especially in natural communities.
The network analysis has established that the natural communities’ structure is not a random result [6, 9, 19, 20], but is the result of the precise combination of several processes. Many of these regulatory processes are emergent from the interaction between three or more species (high order interactions, indirect effects, interactions modifications), so it cannot be observed or inferred by studying the interaction between species pairs [9, 21-25]. In this context, studies based on trophic interactions are the first step in the development of hypotheses about the homeostatic feedback of natural communities, consequently; the comparative analysis of the diet composition, allows building food webs schemes that serves as a basis for proposing diverse hypotheses on the regulation and dynamics of the system under study.
In other hand, the study of the mechanisms that determinate the structure and dynamics of marine communities under fisheries exploitation is particularly relevant because the importance of the adequate management of exploited populations, even so, it is common the extensive use of analytical approaches [26-30].
Furthermore, the large-scale fisheries emergent around the world over the last thirty years has caused a shift in how to approach the management, resulting in the gradual incorporation into the handling of variables not directly related to the stocks under exploitation (e.g. the influence of other species that can modify the abundance of commercial species by interespecific relationships as predation or competition); that means the incorporation of those variables into dynamic models of fish stocks [31].
The understanding of food web changes is one of the major issues of modern ecology [32-37]. By analyzing how groups are assembled and develop, would give an insight into the organization of biological ecosystems. In particular, one of the main focuses of food web theory is to understand how structural properties change with the scale of the system [38, 39]. Different methodological approaches have been proposed to quantify the magnitude of the relationships between species or species groups, and to assess the relative importance of each component has on the overall system maintenance [40], The most common approach employed in the last four decades, biomass balance, Ecopath models [41, 42]. Habitat damage and mishandling of resources could increase mortality along trophic web [43-46], and modify the relationship between functional groups [47, 48].
Particular attention has been paid to the development of ecosystem models (mass-balance, Ecopath) that synthesize the trophic interaction patterns of a particular food web. These models have been widely accepted by the international scientific community, having been applied to more than 150 ecosystems around the world [41, 42]. Ecopath is a theoretical approach that encourages the development of trophic models of aquatic ecosystems through mass- adjusting; also, permits examination of various aspects of the subsequent food web network. Input data required includes estimates of biomass, production, consumption, diet and harvests for each group considered [49].
The study of ecological networks has centered around their inward structural and / or functional characteristics (e.g. biological process, inter or intra relationships, food connections). A noteworthy progress of those lines of investigation has been the acknowledgement that food webs are closely related to the whole system´s dynamic. However, few efforts have been made to study the structure and association of interconnected marine waterfront biological communities, which the exchange of energy (matter) through trophic flows is recognized.
On the other hand, commercial fishing catches have decreased substantially in recent years in south-central Gulf of Mexico [50]. As a result, human impacts on the local environment are of increasing concern [51, 52]. In this sense, Ecopath models represent a modelling approach alternative to evaluate changes in the coastal marine ecosystems being able to be structural or functional. Direct and indirect effects of species on others into the system can also be explored, as well as the overall functioning of the ecosystem. However, it is important to note that our knowledge on direct and indirect effects of species, is limited and it is therefore necessary to develop a greater number of models to find ecosystem attributes that can be used as biological reference points, similar to those used in models conventionally used in fisheries biology [53].
The main activity in Mexican waters is the shrimps trawl fishery, whit a large bycatch most of the times consisting of juveniles of commercially important teleostean fishes such as croakers, pompanos, snappers, groupers, etc., most of which is discarded. In last years, fisheries production has declined [50] besides, some biological parameters as the average size of individual fish [54]. Also, data presented by Abarca-Arenas et al. [55, 56] on bycatch of shrimp fishery boats trawlers and observations by Cházaro-Olvera et al. [51] suggest a marked increase in the abundance of by-catch and portunid crabs in the shrimp by-catch in the Gulf of Mexico.
In this study we develop a trophic model to characterize the structure and function of two coastal marine ecosystems, Alvarado lagoon (Mexico) and the adjacent continental shelf, both considered important areas for penaeid shrimps and demersal fish. These ecosystems are characterized to interchange biota and, therefore, matter and energy through a feeding relationship, since they are connected through an artificial mouth in the northern at Camaronera lagoon and by a natural mouth in the southern part of the system. In order to address this objective, we examined 66 functional groups based on estimates of biomass, production, consumption, diet and harvest for each group, using Ecopath model of biomass balance that aid to synthesize the trophic interaction patterns of a particular ecosystem. This approach ensures a better description of the trophic relationships, energy flows, and transfer efficiency of the food web.
2. MATERIALS AND METHODS
2.1. Study Area
Alvarado lagoon is a medium coastal lagoon of about 17 km along the north western central Gulf of Mexico, it is composed of four minor lagoons: Alvarado, Tlalixcoyan, Buen País and Camaronera (Fig. 1). The exchange of water masses with the adjacent sea is through an artificial mouth in the northern of the Camaronera lagoon (channel of 40 meters wide with two tubes with a diameter of 2 meters each) and through a natural mouth (shipping channel 0.45 km. wide) in the southern part of the system. Alvarado lagoon is shoal with two meters in depth in average. Within the lagoon the rivers Papaloapan, Blanco and Acula converge, which release masses of fresh water seasonally [57-59]. A great interaction with adjacent system is recognized, which contributes to its high biological productivity. Since 2003 Alvarado lagoon system was recognized as a RAMSAR site and is believed to sustain the biggest population of manatees (Trichechus manatus) in Veracruz State [60].
 |
Fig. (1). Study area. Continental shelf of the southwest Gulf of Mexico showing the main commercial shrimp fishery area (shadow area). |
Adjacent continental shelf of Alvarado, is located in front of the coastal plain of Veracruz, Mexico (Fig. 1). The environment of the continental shelf is influenced by fresh water from nearby rivers (i.e., the Papaloapan, Coatzacoalcos, and Panuco) that drain into several coastal lagoons and estuaries [61]. One of the largest is the Alvarado lagoon, which includes an adjacent platform composed primarily of clay and sand [51, 62]. These particular hydrobiological conditions explain the elevated levels of organic material and nutrients reported for the zone [63]. In recent years, the continental shelf off Alvarado has been subjected to considerable environmental stress resulting from human settlement along the coast (increasing the discharge of wastewater) and a variety of economic activities undertaken in the region (i.e., fishing, the transportation and extraction of crude oil, and recreational activities) that have caused habitat fragmentation [64. 65]. Three distinct and well- defined seasons are recognized in the study area: a hot, dry spring (March-May); a hot, rainy summer (June-September); and the period between October and February, which is characterized by strong northerly winds (> 80 kmh-1), limited precipitation (20-60 mm), and cooler temperatures (< 22° C).
2.2. Trophic Model of Biomass Balance
The Ecopath model of biomass balance [41, 66-69] is based on the assumption that the production of a given group of prey (i) is equal to the biomass lost via fishing or exportation, predation (natural mortality), or other sources of mortality. Biomass balance can be expressed using the following equation:
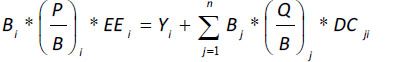 |
where Bi is the biomass of functional group 1 during a particular period for i = 1…n functional groups; P/B is the biomass production rate, which is equal to the total instantaneous mortality rate (Z) at equilibrium [70]; and EE is the ecotrophic efficiency (portion of production that is consumed, fished, or exported). Y is the catch per unit of time and space (Yi = FiBi, where Fi is the instantaneous mortality rate due to fishing), Bj is the predator (j) biomass, Q/B is the consumption/ biomass rate, and DCij is the portion of the diet of a given predator (j) occupied by a particular type of prey (i).
For each component included in the biomass-balance model, the following data must be included: production/ biomass (P/B), consumption/ biomass (Q/B), portion of habitat area occupied by the group, biomass of the entire habitat area (tkm2), diet composition, and mortality due to commercial fishing. The construction of the model does not require that all parameters be input for all groups or trophic components. Ecopath relates the production of a given group to the remaining groups via the alimentary components, permitting estimation of any missing parameters. This process is based on the assumption that the production of a particular group ends up in some part of the system.
2.3. Functional Groups
The model is composed of 66 functional groups (Annex S1): marine mammals (two groups), marine birds (one group), fish (38 groups), crustaceans (five groups), mollusks (six groups), polychaetes (two groups), echinoderms (one group), other invertebrates (meiobenthos, two groups), zooplankton (two groups), primary producers (four groups), detritus (two groups), by-catch shrimp (one group). Table 1 summarizes the data for each of the parameters input for each group: commercial catch (Y, tkm2year-1), biomass (B, tkm2year-1), production /biomass (P/B, year-1, equal to the total mortality, Z), consumption/ biomass (Q/B, year-1), Ecotrophic Efficiency (EE), and diet. Annex S2 presents the parameters used to estimate the Q/B for the groups of fish, while Annex S3 is the adjusted diet matrix.
| Input Original Data | Output Data Estimated for the Ecopath Model | ||||||||||||||||
|---|---|---|---|---|---|---|---|---|---|---|---|---|---|---|---|---|---|
| Group name | Y | B | P/B | Q/B | EE | TL | B | P/B | Q/B | EE | P/Q | R/B | R/A | P/R | FD | NE | OI |
| Adjacent continental shelf | - | - | - | - | - | - | - | - | - | - | - | - | - | - | - | - | - |
| Sea mammals | 0 | 0.032 | 1.9 | 22.09 | - | 3.87 | 0.03 | 1.99 | 22.9 | <0.001 | 0.08 | 16.4 | 0.89 | 0.12 | 0.21 | 0.1 | 0.53 |
| Sea birds | 0 | - | 0.3 | 68.4 | 0.005 | 3.77 | 0.001 | 6 | 68 | 0.03 | 0.08 | 48.4 | 0.88 | 0.12 | 0.02 | 0.11 | 0.45 |
| Coastal sharks | 0 | 0.03 | 0.3 | 6.3 | - | 4.18 | 0.03 | 0.35 | 6.4 | 0.65 | 0.05 | 4.8 | 0.93 | 0.07 | 0.04 | 0.06 | 0.23 |
| Rays/skates | 0 | 0.119 | 0.3 | 7.2 | - | 3.36 | 0.12 | 0.38 | 4.9 | 0.11 | 0.07 | 3.5 | 0.9 | 0.1 | 0.15 | 0.09 | 0 |
| Mackerels | 0 | 0.059 | 1.4 | 7.4 | - | 3.99 | 0.06 | 1.4 | 7.3 | 0.54 | 0.19 | 4.4 | 0.76 | 0.31 | 0.12 | 0.23 | 0.04 |
| Goatfish | 0.135 | 2.776 | 2.6 | 7.2 | - | 2.95 | 2.56 | 2.48 | 7.3 | 0.75 | 0.33 | 3.4 | 0.57 | 0.72 | 5.35 | 0.42 | 0.3 |
| Flatfish | 0.054 | 2.497 | 0.7 | 2.2 | - | 3.1 | 2.49 | 0.79 | 8 | 0.35 | 0.09 | 5.6 | 0.87 | 0.14 | 5.25 | 0.12 | 0.18 |
| Croakers/drums | 0.042 | 1.14 | 0.6 | 5.4 | - | 3.06 | 1.14 | 0.64 | 5.5 | 0.24 | 0.11 | 3.7 | 0.85 | 0.16 | 1.81 | 0.14 | 0.45 |
| Herrings | 0 | 16.888 | 2 | 8.4 | - | 2.89 | 17.8 | 1.96 | 8.5 | 0.34 | 0.22 | 4.9 | 0.71 | 0.39 | 53.75 | 0.28 | 0.15 |
| Lizardfish | 0.07 | 0.668 | 0.3 | 5.5 | - | 4.09 | 0.67 | 0.3 | 5.8 | 0.82 | 0.05 | 4.4 | 0.93 | 0.06 | 0.82 | 0.06 | 0.08 |
| Gruopers | 0 | 0.328 | 0.7 | 4.9 | - | 3.92 | 0.34 | 0.69 | 4.9 | 0.02 | 0.13 | 3.3 | 0.82 | 0.2 | 0.57 | 0.17 | 0.3 |
| Jacks/pompanos | 0 | 0.454 | 1.3 | 3.2 | - | 3.47 | 0.46 | 1.38 | 8.7 | 0.66 | 0.15 | 5.5 | 0.8 | 0.24 | 1.01 | 0.19 | 0.17 |
| Filefish | 0.017 | 0.272 | 1.4 | 15.8 | - | 2.92 | 0.28 | 1.41 | 6.1 | 0.33 | 0.23 | 3.4 | 0.71 | 0.4 | 0.6 | 0.28 | 0.37 |
| Cutlassfishes | 0 | 0.286 | 0.4 | 7.7 | - | 4.02 | 0.3 | 0.46 | 3.4 | 0.43 | 0.13 | 2.2 | 0.83 | 0.2 | 0.27 | 0.16 | 0.02 |
| Sphyraenidae | 0 | 0.234 | 0.1 | 7.6 | - | 3.95 | 0.24 | 0.18 | 7.7 | 0.33 | 0.02 | 6 | 0.97 | 0.03 | 0.39 | 0.03 | 0.28 |
| Searobins | 0 | 0.26 | 0.7 | 3.2 | - | 3.39 | 0.26 | 0.71 | 3.3 | 0.09 | 0.21 | 1.9 | 0.73 | 0.36 | 0.34 | 0.26 | 0.07 |
| Snappers | 0 | 0.237 | 0.7 | 4.4 | - | 3.05 | 0.23 | 0.74 | 4.4 | 0.7 | 0.16 | 2.8 | 0.79 | 0.26 | 0.25 | 0.21 | 0.28 |
| Mojarras | 0 | 0.166 | 2.4 | 6.3 | - | 2.65 | 0.17 | 2.45 | 6.5 | 0.06 | 0.37 | 2.8 | 0.53 | 0.87 | 0.6 | 0.46 | 0.53 |
| Pinfish/Porgies | 0 | 0.089 | 3.1 | 13.9 | - | 2.76 | 0.09 | 3.09 | 14 | 0.57 | 0.21 | 8.1 | 0.72 | 0.37 | 0.36 | 0.27 | 0.35 |
| Sea catfish | 0 | 0.012 | 1.6 | 13.8 | - | 2.96 | 0.01 | 1.59 | 7.2 | 0.56 | 0.22 | 4.1 | 0.72 | 0.38 | 0.025 | 0.27 | 0.35 |
| Snooks | 0.002 | 0.007 | 0.5 | 5.5 | - | 3.5 | 0.01 | 0.58 | 5.6 | 0.68 | 0.1 | 3.9 | 0.87 | 0.14 | 0.01 | 0.12 | 0.03 |
| Mullets | 0 | 0.556 | 0.6 | 10.4 | - | 2.02 | 0.55 | 0.63 | 10.5 | 0.69 | 0.05 | 7.7 | 0.92 | 0.08 | 1.26 | 0.07 | 0.02 |
| Grunts | 0 | 0.302 | 2.5 | 7.4 | - | 3.58 | 0.31 | 2.57 | 9.8 | 0.7 | 0.26 | 5.2 | 0.67 | 0.48 | 0.84 | 0.32 | 0.69 |
| Eels-morays | 0 | 0.334 | 0.9 | 8.2 | - | 3.45 | 0.35 | 0.93 | 8.4 | 0.01 | 0.1 | 5.8 | 0.86 | 0.15 | 0.9 | 0.13 | 0.64 |
| Toadfish | 0 | 0.186 | 0.8 | 3.6 | - | 2.86 | 0.19 | 0.88 | 3.6 | 0.01 | 0.24 | 2 | 0.69 | 0.43 | 0.29 | 0.3 | 0.51 |
| Other fishes | 0 | 0.7 | 2.1 | 7.1 | - | 2.86 | 0.71 | 2.11 | 7.4 | 0.88 | 0.28 | 3.8 | 0.64 | 0.54 | 1.23 | 0.35 | 0.46 |
| Squids | 0 | - | 3.2 | 19.9 | 0.9 | 3.48 | 1.85 | 3.17 | 9 | 0.5 | 0.35 | 4 | 0.56 | 0.78 | 6.27 | 0.43 | 0.21 |
| Octopuses | 0 | - | 2.4 | 5.8 | 0.9 | 3.2 | 1.05 | 2.42 | 6 | 0.83 | 0.39 | 2.4 | 0.5 | 0.98 | 1.7 | 0.49 | 0.37 |
| Crabs | 0 | - | 1.9 | 17.2 | 0.9 | 2.26 | 0.77 | 1.88 | 8.4 | 0.75 | 0.22 | 4.9 | 0.72 | 0.38 | 1.67 | 0.27 | 0.22 |
| Penaeid shrimps | 3.881 | - | 3.8 | 32.3 | 0.9 | 2.63 | 2.1 | 3.46 | 8.2 | 0.99 | 0.42 | 3.1 | 0.47 | 1.11 | 3.52 | 0.52 | 0.3 |
| Others crustaceans | 0 | - | 2.9 | 8.1 | 0.9 | 2.41 | 6.07 | 2.83 | 8.9 | 0.77 | 0.31 | 4.3 | 0.6 | 0.65 | 14.84 | 0.39 | 0.3 |
| Echinoderms | 0 | - | 1.6 | 3.7 | 0.9 | 2.51 | 3.03 | 1.69 | 3.7 | 0.69 | 0.44 | 1.3 | 0.43 | 1.28 | 3.88 | 0.56 | 0.4 |
| Gastropods | 0 | - | 3.4 | 12.7 | 0.9 | 2.85 | 0.66 | 3.51 | 12.8 | 0.98 | 0.27 | 6.7 | 0.65 | 0.52 | 1.74 | 0.34 | 0.32 |
| Polychaets | 0 | - | 4 | 25 | 0.9 | 2.2 | 6.82 | 3.96 | 25.9 | 0.56 | 0.15 | 16.8 | 0.8 | 0.23 | 47.39 | 0.19 | 0.17 |
| Bivalves | 0 | - | 2.7 | 9.3 | 0.9 | 2.09 | 3 | 2.72 | 9.2 | 0.77 | 0.29 | 4.7 | 0.63 | 0.57 | 7.46 | 0.36 | 0.09 |
| Meiobenthos | 0 | - | 5.9 | 19.4 | 0.9 | 2.06 | 22.5 | 5.96 | 21.6 | 0.5 | 0.27 | 11.3 | 0.65 | 0.52 | 164.81 | 0.34 | 0.07 |
| Zooplankton | 0 | - | 27.1 | 72.9 | 0.9 | 2.06 | 14.1 | 25.9 | 77.1 | 0.71 | 0.33 | 35.8 | 0.58 | 0.72 | 323.22 | 0.41 | 0.06 |
| Phytoplankton | 0 | - | 119 | - | 0.9 | 1 | 12 | 119 | 0 | 0.62 | - | - | - | - | 545.54 | - | 0 |
| Benthic producers | 0 | 1.228 | 12.7 | - | 0.9 | 1 | 0.25 | 12.7 | 0 | 0.43 | - | - | - | - | 1.81 | - | 0 |
| Shrimp fishery by-catch | 0 | 0.55 | - | - | 0.9 | 1 | 0.55 | - | - | 0.99 | - | - | - | - | 0.06 | 0 | 0.12 |
| Detritus | 0 | 6.2 | - | - | 0.9 | 1 | 6.2 | - | - | 0.42 | - | - | - | - | 0 | 0 | 0.34 |
| Alvarado lagoon | - | - | - | - | - | - | - | - | - | - | - | - | - | - | - | - | - |
| Sea mammals | 0 | 0.003 | 2.3 | 29.6 | - | 3.77 | <0.001 | 2.29 | 29.7 | 0.06 | 0.07 | 29.6 | 1.24 | 0.07 | 0.09 | 0.45 | |
| Rays/skates | 0 | 0.009 | 1 | 9.5 | - | 3.35 | 0.01 | 1.1 | 9.6 | 0.1 | 0.11 | 6.5 | 0.85 | 0.16 | 0.02 | 0.14 | 0.04 |
| Flatfish | 0 | 0.596 | 0.7 | 2.7 | - | 3.08 | 0.59 | 0.76 | 2.7 | 0.61 | 0.27 | 1.4 | 0.65 | 0.53 | 0.49 | 0.34 | 0.16 |
| Croakers/drums | 0.05 | 1.292 | 0.6 | 4.5 | - | 3.12 | 1.38 | 0.59 | 4.6 | 0.44 | 0.12 | 3.1 | 0.84 | 0.18 | 1.73 | 0.15 | 0.23 |
| Herrings | 0 | 1.256 | 3.8 | 11.3 | - | 2.87 | 1.27 | 3.88 | 11.3 | 0.44 | 0.34 | 5.1 | 0.57 | 0.74 | 5.61 | 0.42 | 0.16 |
| Jacks/pompanos | 0 | 0.31 | 0.6 | 9.4 | - | 3.22 | 0.31 | 0.64 | 9.6 | 0.58 | 0.06 | 7 | 0.91 | 0.09 | 0.68 | 0.08 | 0.08 |
| Needlefish | 0 | 0.357 | 1.2 | 6.5 | - | 3.59 | 0.37 | 1.19 | 6.6 | 0.02 | 0.17 | 4.1 | 0.77 | 0.28 | 0.91 | 0.22 | 0.23 |
| Snappers | 0.06 | 0.178 | 0.6 | 3.4 | - | 3.43 | 0.18 | 0.61 | 3.4 | 0.8 | 0.17 | 2.1 | 0.77 | 0.28 | 0.14 | 0.22 | 0.1 |
| Mojarras | 0.05 | 5.881 | 2.1 | 13.7 | - | 2.39 | 5.99 | 2.11 | 14 | 0.31 | 0.15 | 9.1 | 0.81 | 0.23 | 25.53 | 0.18 | 0.27 |
| Pinfish/Porgies | 0 | 0.221 | 0.7 | 9.1 | - | 2.98 | 0.22 | 0.73 | 9.1 | 0.84 | 0.08 | 6.5 | 0.89 | 0.11 | 0.41 | 0.1 | 0.27 |
| Sea catfishes | 0 | 3.609 | 1.4 | 7.4 | - | 2.65 | 3.75 | 1.44 | 7.9 | 0.11 | 0.18 | 4.9 | 0.77 | 0.29 | 10.81 | 0.22 | 0.4 |
| Snooks | 0.08 | 0.696 | 0.4 | 4.7 | - | 3.48 | 0.72 | 0.44 | 4.8 | 0.27 | 0.08 | 3.4 | 0.88 | 0.12 | 0.92 | 0.11 | 0.03 |
| Mullets | 0.04 | 0.298 | 1.2 | 10.9 | - | 2.02 | 0.3 | 1.23 | 10.8 | 0.41 | 0.11 | 7.4 | 0.85 | 0.16 | 0.88 | 0.14 | 0.02 |
| Toadfish | 0 | 0.512 | 0.6 | 4.1 | - | 2.82 | 0.51 | 0.66 | 4.2 | 0.63 | 0.15 | 2.7 | 0.8 | 0.23 | 0.55 | 0.19 | 0.34 |
| Sleepers | 0.08 | 1.39 | 0.5 | 1.9 | - | 2.3 | 1.39 | 0.56 | 1.9 | 0.63 | 0.28 | 1.5 | 1.02 | 0.35 | 0 | 0.35 | 0.25 |
| Crabs | 0.03 | - | 2.3 | 8.5 | 0.85 | 2.37 | 1.61 | 2.37 | 8.6 | 0.86 | 0.27 | 4.5 | 0.65 | 0.52 | 3.33 | 0.34 | 0.3 |
| Penaeid shrimps | 2.06 | 2.186 | 5.6 | 25.3 | 0.85 | 2.41 | 1.06 | 5.66 | 25.7 | 0.99 | 0.21 | 14.9 | 0.72 | 0.37 | 5.48 | 0.27 | 0.29 |
| Gastropods | 0 | 1.848 | 3.1 | 18.4 | 0.9 | 2.34 | 1.81 | 3.06 | 18.4 | 0.71 | 0.16 | 11.7 | 0.79 | 0.26 | 8.29 | 0.2 | 0.24 |
| Polychaets | 0 | - | 6.9 | 22.3 | 0.9 | 2.32 | 1.88 | 6.91 | 22.8 | 0.73 | 0.3 | 11.3 | 0.62 | 0.6 | 12.14 | 0.37 | 0.24 |
| Bivalves | 0 | - | 2.76 | 11.7 | 0.9 | 2.27 | 3.97 | 2.75 | 11.8 | 0.46 | 0.23 | 10.6 | 1.11 | 0.25 | 0 | 0.28 | 0.21 |
| Meiobenthos | 0 | 9.616 | 9.7 | 23.8 | 0.9 | 2.06 | 9.63 | 9.45 | 24.7 | 0.64 | 0.38 | 10.3 | 0.52 | 0.91 | 80.63 | 0.47 | 0.06 |
| Zooplankton | 0 | - | 16.9 | 66.5 | 0.9 | 2.05 | 6.69 | 16.2 | 71.6 | 0.66 | 0.22 | 41.1 | 0.71 | 0.39 | 132.43 | 0.28 | 0.05 |
| Phytplankton | 0 | 13.064 | 126.5 | - | 0.9 | 1 | 10.4 | 98.2 | 0 | 0.53 | - | - | - | - | 486.56 | - | 0 |
| Benthic producers | - | - | 13.6 | - | 0.9 | 1 | 23 | 13.1 | 0 | 0.03 | - | - | - | - | 293.75 | - | 0 |
| Detritus | 0 | 4 | - | - | 0.9 | 1 | 4 | - | - | 0.89 | - | - | - | - | 412.21 | 0 | 0.36 |
2.4. Pedigree of the Input Data
A model’s pedigree is a summary of the uncertainty related with the information sources [41, 42]. A qualification (confidence) can be assigned to each data point input in the model (B, P/B, Q/B, catch, DC), based on the source of that data. For each input data that we use in a given model, a choice can be made to describe the kind of data used (e.g. sampling based, high precision; sampling based, low precision; approximate or indirect method; guesstimate; from other model; estimated by Ecopath), and thus the confidence we can have in these data. By calculating the confidence of each input data point, the model’s global pedigree can be calculated as the average of the individual values [48]. The global pedigree value can be used for comparison with other models [69]. A model’s pedigree is a measure of its quality based on the trustworthiness of the input data. The pedigree index P is calculated based on the following formula:
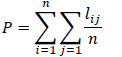 |
where, lij is the pedigree index for model group i and parameter j, n is the total number of functional groups.
2.5. Model Statistics
Biomass-balance model uses several different statistics to describe the structure of the ecosystem in energetic terms, including total flows, consumption flows, respiration flows, exportation, detritus, and net primary production. Ecopath estimates two global indices: 1) the omnivory index, which represents the average diet breadth of the consumers based on the average consumption of each consumer, and 2) the connectancy index, which estimates the proportion of the number of trophic ties with respect to the total number of possible connections. Moreover, Ecopath includes a suite for estimating the average trophic level of the commercial takes.
The trophic structure was aggregated into a Lindeman spine, an analysis of discrete Trophic Levels (TL) sensu Lindeman [71] and proposed by Ulanowicz [72]. In this routine, the system was aggregated into a linear food chain where import (on TL I only), consumption by predators, export, flow to the detritus, respiration, and throughput were calculated for each TL. The detritus compartment was separated from primary producers to show the amount of energy that is flowing through it. These flows were also represented by means of a flow diagram showing the trophic interactions between all groups within the ecosystem. The transfer efficiency is defined as the fraction of the total flows at each trophic level that is either exported or transferred to other TLs through consumption. The mean TE is calculated as a geometric mean from the TE in Trophic Levels (TL) II–IV [73].
2.6. Finn’s Cyclying Index
The Finn’s Cyclying Index (FCI) [74] is the fraction of the ecosystem’s throughput that is recycled. This index utilizes the Leontief matrix to assess the amount of material cycling within an ecosystem, and is calculated as:
 |
Where 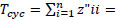 the proportion of Total System Throughput (TST) which represent recycled flow, and z”ii = the total flow from i which returns to i (without recycling i in route) over all pathways of all lengths. The FCI varies from zero (no cycling) to 1 (full cycling), an is also an indicator of system´s maturity [75, 76].
2.7. Exploitation Status of the Fishery
The fisheries impacts were assessed by analyzing the mean trophic level of the catch (TLC), the exploitation rates (F/Z), the relative consumption of total production representing the proportion of total production that is consumed within the system by all the functional groups, Fishing mortalities (F), the Gross Efficiency of the fishery (GE, catch/net primary production), and the percentage of Primary Production Required (PPR) to evaluate the sustainability of fisheries [77, 78].
2.8. Mixed Trophic Impact
This analysis allows the estimation of the relative impact of a change in the biomass of the one group on other components of ecosystem, under assumption that the diet composition remains constant [79]. Two components without this kind of relation would have zero impact on each other [80].
In the mixed trophic impact analysis approach, the positive effect that a prey (i) has on its predator (j) can be shown as:
 |
where, k represents all the of j and gij ranging from 0 to 1 (Leontief, 1951).
Conversely, the negative impact of predator upon its prey [81] is given by
 |
where, m represents all the predators of the prey species i.
2.9. Key Species Index
We also calculated the key species index (KS) [82] in order to identify the most ecologically relevant species in the system. That is, the functional groups or species with a disproportionately high global effect on the biomass. Because every impact can be quantitatively positive or negative, a new measure of the overall effects must be determined for each species or functional group (Ɛj) using the following mathematical equation:
 |
where mij corresponds to the elements of the MTI matrix and quantifies the direct and indirect effects (affecting) species or group i has on any (affected) group k of the food web. However, the effect of the change in a group’s biomass on the group itself (i.e., mij) is not included. The contribution of biomass from every species or functional group with respect to the total biomass of the network was estimated using the following equation:
 |
where pj is the portion of biomass of each group Bi with respect to the sum of the total biomass Bk. Therefore, to balance the overall effect and the biomass. The Keystone index (KSi) for each species or functional group was calculated as KSj= log[Єj(1- pj)]; which integrate the two previous equations. This index assigns high values of functional keystonesess to those variables (species) or functional groups that have low biomass and high overall effect.
2.10. Maturity Indices
Several network analysis indices are also produced by Ecopath, which are useful for determining an ecosystem’s structure, maturity, and stability [74, 83]. These indices are Total System Throughput (TST), Ascendency (A), system capacity (C), and system overhead, which is based on ascendency and capacity. We also estimated the flows from primary producers and detritus. Ascendency represents a measure of the average mutual information. That is, the uncertainty associated with the route a given unit of biomass (or energy) follows within the system based on the total possible routes available. The development capacity is the upper limit of the ascendency measure, and can be calculated as:
 |
where H is defined as the statistical entropy, calculated as:
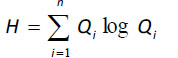 |
where Qi is the probability that a particle of energy will pass through I in terms of the total flows of the ecosystem [84, 85]. The surplus is the difference between the ascendency and the development capacity [84, 85].
3. RESULTS
3.1. Model Balance and Pedigree
The input values and those estimated under the model’s assumption of biomass balance are shown in Table 1. The model’s pedigree index was PI= 0.47.
3.2. Structure of the Trophic Web and Analysis of Flows
The trophic level of the ecosystem’s components fluctuated between 1 and 4.18 (Table 1). The ecosystem’s apex predators (TL > 4) include, Trichiuridae (TL = 4.02), Synodontidae (TL = 4.08) and coastal sharks (TL = 4.18). Several groups of fish (Sphyraenidae, Serranidae), marine mammals, and marine birds as well as the cephalopods (squid and octopus) occupied higher trophic levels (>3.5). Primary producers, detritus, and the bycatch of shrimp fishing had TL = 1. Ecotrophic efficiency values varied from 0.003 for marine mammals to 0.99 for shrimp penaeid (lagoon). Ecotrophic efficiency for the majority of groups was less than 0.75 (Table 1).
3.3. Trophic Aggregation
Fig. (2) illustrates a Lindeman spine with trophic chain and showing the trophic level II (TLII) consumptions is higher by detritus chain (D) than primary production (P) in a ratio 18:1 (D:PP). Most of the level II flows can be attributed to zooplankton (primary dominant consumers) and meiobenths and polychaets (dominant detritophages)). Flows in trophic level III derive from herrings and polychaets (lagoon). In the highest trophic levels, flows may be attributed to Synodontidae, and Muraenidae.
3.4. System Bioenergetics
The average transfer efficiency in the ecosystem was 13%. The average trophic level of commercial takes was 2.80, with penaeid shrimps shelf (TL = 2.63) and penaeid shrimp lagoon (TL = 2.95) being the most highly exploited fishing resources.
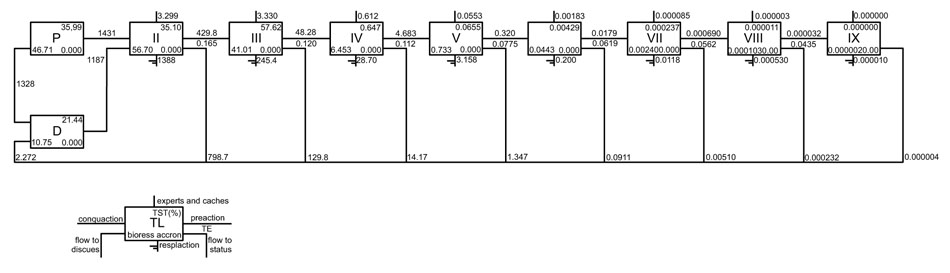 |
Fig. (2). The spine Lindeman diagram. Shows the trophic aggregation in nine discrete trophic levels for the Alvarado lagoon and adjacent continental shelf model. |
3.5. Analysis of Biomass, Flows, and Commercial Landings
Biomass was largely concentrated in the lower trophic levels and attributable to both pelagic and benthic groups like benthic primary producer (lagoon), meiobenthos (shelf), herrings (shelf), zooplankton (shelf) and phytoplankton (shelf and lagoon) (Table 1). The Alvarado lagoon and continental shelf adjacent ecosystem’s energy budget can be broken down as follows: flows to consumption (42.1%), respiration (22.1%), and detritus (35.6%) (Table 1). Export flows and commercial catch contributed < 0.1% of Total System Throughput flow. First trophic levels (1a ~ 2.5) are strong negatively related with respiration and production; whereas in groups of higher trophic level, this trend remains but is not as marked (Fig. 3). The magnitude of the y- intercept reflects the magnitude of energy expenditure into the ecosystem. Moreover, the slopes (bP = -4.46 and bR = - 4.48) indicate that production and respiration decrease proportionally as trophic level increases. The groups with the highest production and respiration rates (energy expenditure) are zooplankton (shelf and lagoon), meiobenthos (shelf), polychaetes (shelf), herrings (shelf) and meiobenthos (lagoon). Consumption was dominated by zooplankton (shelf and lagoon), meiobenthos (shelf and lagoon), polychaetes (shelf), and herrings (shelf).
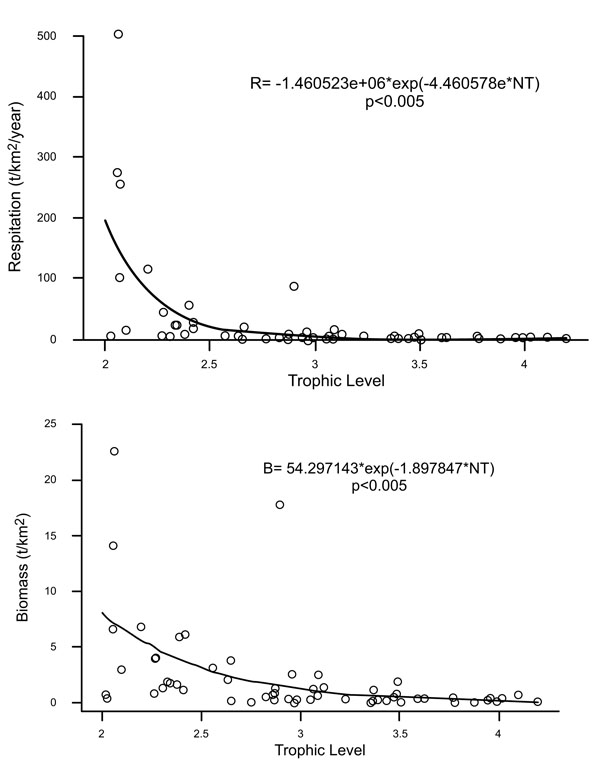 |
Fig. (3). Relationship for respiration (3a) and production (3b) over trophic level, showing a general tendency to decrease while trophic levels increase. |
3.6. Mean Trophic Level of the Catch
Commercial fisheries arrivals were largely dominated by species from lower trophic levels (i.e., Penaeidae, Portunidae, Gerreidae, Mugilidae, and Mullidae; TLC = 2. 8) (Table 2).
| Parameter | Value | Units |
|---|---|---|
| Sum of all consumption | 3177.75 | tkm-²/year-1 |
| Sum of all exports | 7.201 | tkm-²/year-1 |
| Sum of all respiratory flows | 1666.49 | tkm-²/year-1 |
| Sum of all flows into detritus | 2648.68 | tkm-²/year-1 |
| Total system throughput | 7664.68 | tkm-²/year-1 |
| Sum of all production | 3650.13 | tkm-²/year-1 |
| Mean trophic level of the catch | 2.64 | - |
| Gross efficiency (catch/net p.p.) | 0.00261 | - |
| Input total net primary production | - | |
| Calculated total net primary production | 2758.97 | tkm-²/year-1 |
| Total primary production/total respiration | 1.65 | - |
| Net system production | 1092.46 | tkm-²/year-1 |
| Total primary production/total biomass | 15.27 | - |
| Total biomass/total throughput | 0.023 | - |
| Total biomass (excluding detritus) | 180.66 | tkm-² |
| Total catches | 7.201 | tkm-²/year-1 |
| Connectance Index | 0.124 | - |
| System omnivory index | 0.232 | - |
| Throughput cycled (excluding detritus) | 75.88 | tkm-²/year-1 |
| Ecopath pedigree index | 0.471 | - |
| Predatory cycling index | 2.07 | % of throughput w/o detritus |
| Throughput cycled (including detritus) | 725.4 | tkm-²/year-1 |
| Finn's cycling index | 9.63 | % of total throughput |
| Finn's mean path length | 4.502 | - |
| Finn's straight-through path length | 2.14 | without detritus |
| Finn's straight-through path length | 4.069 | with detritus |
3.7. Flow and Biomass Indicators
Statistics flows and biomass indicators for the Alvarado lagoon-adjacent continental shelf model are shown in Table 2. Total primary production and total biomass rate (it does not include detritus) was relatively high (TPP /TB = 15.27). The total primary production and total respiration rate (TPP/TR) was nearly 1.65. The percentage of recycled flows in the ecosystem is greatly reduced when those derived from detritus are excluded (from 9.62% to 1%). Recycled flows, expressed using Finn’s (74) index, account for 9.63% of the total flows. The average length of the recycling route, or the average number of groups recycled flows passed through, was 4.5. The average omnivory index was 0.23.
3.8. Mixed Trophic Impacts (MTI) and Key Species Index
MTI index shows how biomass rise of a given functional group affects the abundance of other groups. For example, marine mammals (dolphins) and sharks have an adverse effect on nearly every group in the system (e.g. marine mammals, marine birds, batoids, filefish, etc.) and a positive effect on very few groups (sand bass and catfish). The MTI also indicated that zooplankton had positive impact on pelagic groups and an indirect positive impact on shark, because coastal shark largely feed on medium pelagic while zooplankton constitutes a major portion in the diet of medium pelagic group. However, zooplankton showed significantly negative impact on themselves which may be due to the presence of a large proportion of carnivore zooplankton. It is noteworthy that life histories of common zooplankton organisms (e.g. copepods) reveal that zooplankters are herbivorous only at juvenile stages, while they are frequently omnivores or carnivores during adult stage. A moderate negative impact on phytoplankton by zooplankton also indicated the presence of smaller amount herbivore zooplankton in the ecosystem. The positive impact of detritus was evident on most of the functional groups and this point to the importance of detritus in the Alvarado lagoon-adjacent continental shelf ecosystem, especially groups living in benthic environment (i.e.snappers, grunts, groupers, shrimps, and other crustacean) and cephalopods. There was a significant positive impact on detritus since other crustacean (mostly crabs and shrimps) and cephalopods fed largely on them. However, the Ecopath showed an indirect positive impact of zooplankton on shark and was likely to diet selectivity of shark, who fed on pelagic groups (herrings, jacks, mackerels, needlefish) and demersal group (croacker, mullidae, snappers, grunts), while zooplankton represents a major portion of their diet. Among the fish groups, demersal species showed negative impact on most of the groups. Most fish groups had very minimal or less impact on themselves either positive or negative. But, all other functional groups at the lower trophic level except detritus had a negative impact on themselves, showing competition for same resources within the group. However, detritus had neither positive nor negative impact on itself in the Alvarado lagoon-adjacent continental shelf ecosystem. Based on the results is not possible to observe any kind of control of the food web, top-down or bottom-up (Fig. 4).
3.9. Key Species Index
The most relevant groups in terms of this index were the following: coastal shark (4), marine mammals (1) and penaeid shrimps (46). Other groups with an important trophic position include lagoon-croakers (12), lagoon-snooks (33), and adjacent-croakers (11) (Fig. 5).
| Index | Model | ||
|---|---|---|---|
| ALa | AACSb | AL-AACSc | |
| Sum of consumptions / total system throughput (TFC/TST) | 0.47 | 0.262 | 0.42 |
| Sum of flows to respiration / total system throughput (TFR/TST) | 0.36 | 0.130 | 0.22 |
| Sum of flows to detritus / total system throughput (TFD/TST) | 0.09 | 0.349 | 0.35 |
| Sum of all production / total system throughput (TPP/TST) | 0.58 | 0.463 | 0.48 |
| Total primary production / total respiration (PP/TR) | 1.30 | 2.946 | 1.65 |
| Total primary production / total biomass (PP/TB) | 16.5 | 22.68 | 15.27 |
| Total biomass / total system throughput /TB/TST) | 0.02 | 0.016 | 0.023 |
| Connectance index (IC) | 0.27 | 0.197 | 0.125 |
| System omnivory (SIO) | 0.25 | 0.262 | 0.233 |
| Mean Trophic Level of Catch (MTLC) | 2.31 | 3.1 | 2.80 |
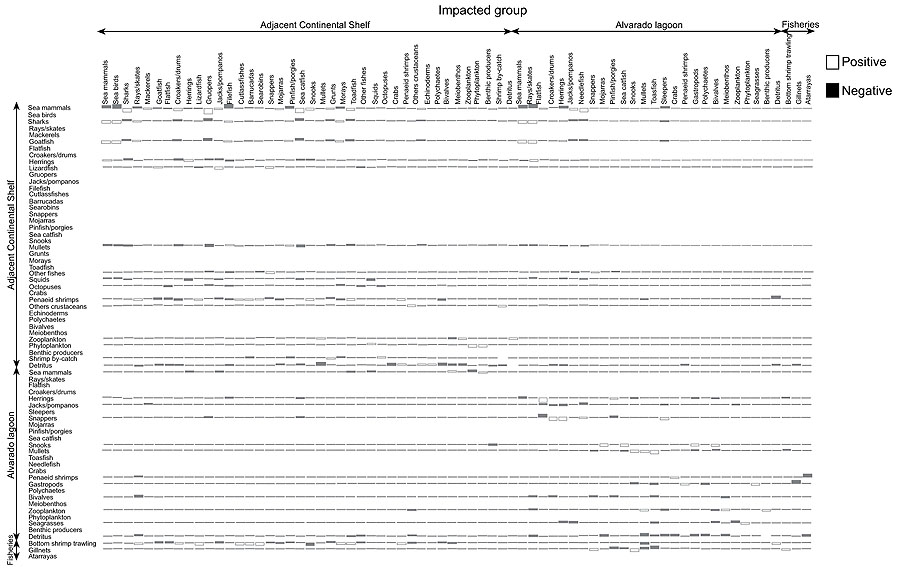 |
Fig. (4). Main mixed trophic impact groups of the Alvarado lagoon and adjacent continental shelf model. |
3.10. Maturity Indices
The Development Capacity (CD) was 41,068 flowbits, while the ascendency (A) was 11,029 flowbits. Ascendency is an indicator of the amount of information in the system as well as a proxy of the development capacity (the upper limit of the ascendency). Thus, the ratio between the two (A/CD) reflects the present state of the ecosystem, which is currently at 26.8% capacity (developing). The overhead (O) was 30,038 flowbits, with 1.46 bits per information content.
4. DISCUSSION
The Ecopath model presented here synthesizes the biological and ecological information available for coastal marine ecosystems coupled: Alvarado lagoon, Mexico and continental shelf adjacent. Several of the species included in the model use both systems to complete some of the stages in their life cycles, whether for reproductive purposes, breeding, protection or feeding [86-88] the exchange of biomass of these species between one system and another is clear, evidencing the need to make a nested model like the one presented here in a first approach. The model used here offers important information regarding the ecosystem’s structure, function, and energy flows, providing a means for comparison with other ecosystems in terms of the system’s energy base and maturity indicators, following Odum [75, 89, 90].
Based on the results of this study, detritophages and non-primary producers are responsible for the transfer of energy toward higher levels. However, the ecotrophic efficiency of detritus was relatively low (EE detritus shelf = 0.42, EE detritus lagoon = 0.47). This could be interpreted as the excessive production of detritus such that only a small proportion is consumed within the system and therefore, exportation and accumulation may occur.
A similar pattern has been observed for upwelling systems, where primary producers tend to have low ecotrophic efficiency ratings [91-93]. They produce such large quantities that little of this biomass is effectively used by the other trophic levels.
Most functional groups making up the trophic structure of the system occupied intermediate trophic levels (II-III), a situation common previously reported for other continental shelf ecosystems [94-96]. This pattern can be attributed to a strong reliance on primary producers [95, 97].
All ecosystems, whether aquatic or terrestrial, generally include four basic functional groups (autotrophs, primary consumers, secondary consumers, and decomposers). Energy and materials flow from autotrophs to degraders via a web of biotic interactions and trophic relations. The production of biomass at each trophic level, the magnitude and velocity with which energy and materials flow through the web, and the complexity of that web vary. However, the majority of the energy and materials are concentrated in the autotroph group, decreasing as they flow towards primary consumers, secondary consumers, and degraders [98].
Some previous works have reported structures dominated by functional groups from higher trophic levels [95, 99]. Others, have reported that different organisms inhabiting coastal environments uses resources from both marine and terrestrial sources. These sources vary by location, and it could include energy from detritus and nutrients (discharged amid their disintegration or absorption) from both local and external sources (macrophytes and phytoplankton) as well as fresh water and estuarine phytoplankton, macrophytes and terrestrial sediments [100-102].
The ecotrophic efficiency of most groups was less than 0.5 (Table 1), suggesting they are not exposed to high mortality rates due to predation or high rates of exploitation due to fishing, or rather that the present exploitation rates do not affect their biotic potential. Functional groups considered species forage (small or intermediate-sized pelagic o demersal species), including Mullidae, meiobenthos, and other crustaceans, had ecotrophic efficiencies > 0.90. Excluding macrophytes (shelf) the majority of the groups with low ecotrophic efficiencies (< 0.1) were apex predators in the trophic web. The low ecotrophic efficiency of some benthic groups can be attributed to their abundance (polychaetes, B = 6.28 tk-2year-1; other crustaceans, B = 3.48 tk-2year-1; bivalves, B = 2.98 tk-2year-1; echinoderms, B = 2.29 tk-2year-1) and the reduced levels of predation they are subjected. Particularly, meiobenthos play a relatively more important role in the transfer of energy, maybe result of their higher renovation rates [62]. As a result, meiobenthos metabolic requirements (secondary production and respiration) may be greater than those required by macrofauna, particularly in ecosystems where the ratio of macrofauna biomass to meiofauna biomass is less than, 5:1 [103, 104]. Thus, the importance of studies regarding the role of meiofauna has been recently acknowledged [62, 105-109], as their role in the benthic trophic web is considered analogous to that of zooplankton in pelagic systems [110].
Interestingly, zooplankton are responsible for approximately 80% of phytoplankton mortality yet they have a relatively high ecotrophic efficiency (EE = 0.77). The reason is that this group serves as forage for several components of the trophic web. Thus, zooplankton have an important role in controlling transfer of energy, facilitating the flow of the elevated production of phytoplankton toward higher trophic levels [111]. These in turn prey intensively on zooplankton (e.g., the cephalopod L. pealei, and some teleosts groups such as Clupeidae and Gerreidae).
The spine Lindeman diagram (Fig. 2) shows that the low levels quantitatively dominate flows and biomass in the system, the role of detritus as the primary source of energy, which stands out. This finding is in agreement with that reported by several other works [95, 96] for other Gulf of Mexico ecosystems. In contrast to Odum’s findings [75], the predominance of the detritus route does not appear to reflect the ecosystem´s maturity. Together, the indicators of omnivory index (SOI = 0.233), connectivity (CI = 0.125), and ascendency (A = 11,029 flowbits ≈ 26.9%), suggest that the system is a developing ecosystem.
The more intensive use of detritus may be related to: ocean circulation patterns created by cyclonic disturbances in the area (which facilitate the re-suspension and confinement of sediments and nutrients), nutrients from water discharged by the various rivers in the region (i.e., Coatzacoalcos, Papaloapan, Blanco, Acula), elevated phytoplankton production (a considerable proportion of which flows toward detritus), benthic biomass (composed of several detritovores), and the resuspension of sediments by trawl fishing [58, 62, 63, 112].
The Lindeman spine (Fig. 2) shows biomass (fluxes) that each component obtain from previous trophic level, also shows the biomass (energy) leaving by other processes as respiration or export, and the net production passed on to the next higher level. The average transfer efficiency (13%) is consistent with the proposed by Lindeman [71] and support for Christensen and Pauly [113] for several coastal marine ecosystems. Most of the output comes from the lowest trophic levels (~95%), while the remaining 5% of the flows derive from the highest trophic levels.
The TPP/TB rate was relatively high, possibly indicating that the ecosystem is in an advanced state of eutrophication (Table 3). Similar values have been observed for other systems with clear signs of environmental deterioration. For example, Barausse et al. [114] reported a TPP/TB ratio equal to 14.5 for the Adriatic Sea, while Heymans et al. [92] published a TPP/TB ratio equal to 16.2 for the northern Benguela upwelling ecosystem. Our interpretation of the TPP/TB (Table 3) for the Alvarado lagoon-continental shelf adjacent ecosystem as evidence of eutrophication is in accordance with Caso et al. [115] and Guentzel et al. [58] finding that the Gulf of Mexico displays varying levels of eutrophication. However, it is important to exercise caution when using this indicator as it is influenced by the functional groups employed to build the model.
 |
Fig. (5). Keystoneness for the functional groups of the Alvarado lagoon and adjacent continental shelf model. For each functional group, the keystone index is reported against overall effect. Overall effects are relative to the maximum effect measured in the trophic web. The species are ordered by decreasing keystoneness. 1. Sea mammals, 2. Sea mammals, 3. Sea birds, 4. Sharks, 5. Rays/skates, 6. Rays/skates, 7. Mackerels, 8. Goatfish, 9. Flatfish, 10. Flatfish, 11. Croakers/drums, 12. Croakers, 13. Herrings, 14. Herrings, 15. Lizardfish, 16. Gruopers, 17. Jacks/pompanos, 18. Jacks, 19. Filefish, 20. Cutlassfishes, 21. Barrucadas, 22. Needlefish, 23. Searobins, 24. Snappers, 25. Snappers, 26. Mojarras, 27. Mojarras, 28. Pinfish/porgies, 29. Pinfish/porgies, 30. Sea catfish, 31. Sea catfish, 32. Snooks, 33. Snooks, 34. Mullets, 35. Mullets, 36. Grunts, 37. Morays, 38. Toadfish, 39. Toadfish, 40. Sleepers, 41. Other fishes, 42. Squids, 43. Octopuses, 44. Crabs, 45. Crabs, 46. Penaeid shrimps, 47. Penaeid shrimps, 48. Others crustaceans, 49. Echinoderms, 50. Gastropods, 51. Gastropods, 52. Polychaetes, 53. Polychaetes, 54. Bivalves, 55. Bivalves, 56. Meiobenthos, 57. Meiobenthos, 58. Zooplankton, 59. Zooplankton, 60. Phytoplankton, 61. Phytoplankton, 62. Sea grass, 63. Benthic producers, 64. Shrimp by-catch, 65. Detritus, 66. Detritus, 67. Bottom shrimp trawling, 68. Gillnets, 69. Atarrayas. |
The TPP/TR rate is also used to assess damage related to human activities. In the first phases of ecosystem development, the TPP/TR should be > 1 as production exceeds respiration; in contrast, systems subjected to organic contamination should have ratios < 1, but if there is a balance between energy production and maintenance costs in mature systems, then the ratio is close to 1 [73, 89]. The SOI also is one of the highest reported for the Gulf of Mexico [94]. If we consider the SOI a measure of the feeding strategies displayed by a given system, we can infer that the trophic web of the study area is composed of functional groups (tropho-species) with relatively broad trophic niches or, alternatively, by components with a certain degree of feeding plasticity, permitting them to adapt to food resource variability. Several works have presented contrasting theories regarding whether omnivores stabilize or destabilize trophic webs; some studies, and the supporting empirical evidence, suggest that omnivores destabilize the trophic web [116-120]. Other theoretical studies including the strength of trophic interactions suggest that omnivory may have a stabilizing effect when trophic connections are not strong [121, 122]. Still other studies suggest that some trophic webs undergo structural changes as a result of invasion by exotic species [123] and exploitation by higher trophic levels [46, 124].
On the other hand, the connectance index was lower than the average value reported for other coastal ecosystems in Mexico (Table 2). This suggests that the complexity of the system trophic web is probably quite highly interconnected, considering that it only represents 12% of the maximum number of possible connections.
The mixed trophic impacts and key species indices suggest that the groups with the greatest influence on the system belong to lower trophic levels (meiofauna, detritus, phytoplankton, and zooplankton), significantly affecting groups of fish and invertebrates (trophic level II-III). However, based on the results is not possible to observe any kind of control of the food web, top-down or bottom- up. The importance of benthic diversity that has been underlined in numerous studies [62, 125]; it is clearly observed in this study, the benthos in the Alvarado Lagoon represents a major trophic resource, and plays an important role in the biogeochemical budget of such as shallow system. Finally, it is also important to mention the role of surplus phytoplankton production and detritus, which is exported to the adjacent continental shelf, through the trophic web of different shared functional groups [126-129].
Except for coastal sharks and marine mammals (shelf), predator functional groups (mainly teleostean and cephalopods species) do not seem to significantly impact their prey, suggesting that higher trophic levels do little to move biomass toward the interior of the ecosystem. Before they were fished intensively, apex predators like coastal sharks, rays/skates, groupers and snappers, were present in greater quantities in the Gulf of Mexico [130-133]. Thus, they presumably had a greater impact on the trophic web, this suggestion requires further data supporting. Results presented here suggests that the ecosystem is dominated by small, fast growing organisms that are resistant to anthropogenic effects, including meiofauna, small demersal fish (Mullidae), and some cephalopods species (Octopus spp. and L. pealei). These organisms have biological traits (high renovation rates) that allow them to recover quickly under considerable fishing pressure and moderate eutrophication, compared to longer living organisms with slower metabolisms. Moreover, these organisms are able to increase their numbers quickly in response to predation.
The ascendency system is in line with values reported for other areas of the continental shelf of the Gulf of Mexico, i.e., Campeche Sound [95]. The ascendency/ capacity ratio, considered a measure of organization and efficiency, may also be seen as a measure of ecosystem maturity and an indicator of the system’s ability to resilience to perturbation [84, 134]. The A/DC ratio is similar to the value reported for other continental shelves [94]. Lower values indicate that a given ecosystem is immature and better able to resist external perturbations [135, 136]. However, the A/C ratio should be considered with care as some authors have found it to be negatively correlated with maturity [76, 137]. Maturity indices suggest that the system is a developing and relatively stable system that can continue to resist human (primarily fishing) or natural impacts without substantial modification of its structure and function, and that relatively few ecosystem components will be greatly affected in the near future. However, over the long term, if commercial fishing takes exceed the biotic potential of species of commercial interest these, and other groups not targeted by extractive activities, may decline.
Finally, we should emphasize that our model was constructed using information available from published sources, thus, the results may change as more and better data become available, and as our methodological techniques improve. Although our study did not include dynamic simulation, we are confident that the model presented here will serve as the basis for identifying gaps in available data and highlighting new areas for investigation. Also it is important to recognize that based on our results we recommend working with models that couple (nested) subsystems, because individual functioning of each one influences the operation of the other, in terms of trophic flows in both directions (interchange of species or stages), which can have substantial implications for the sound management of resources with a ecosystem approach. Moreover, this model may be used for dynamic and spatial simulations to consider the simultaneous use of resources as well as a variety of economic practices like fishing, tourism, and crude oil extraction, restoration, etc.
ETHICS APPROVAL AND CONSENT TO PARTICIPATE
Not applicable.
HUMAN AND ANIMAL RIGHTS
No animals/humans were used for studies that are the basis of this research.
CONSENT FOR PUBLICATION
Not applicable.
CONFLICT OF INTEREST
The authors declare no conflict of interest, financial or otherwise.
ACKNOWLEDGEMENTS
VHCE, LAAC, AFGA, AHL thanks to Instituto Politécnico Nacional, Centro Interdisciplinario de Ciencias Marinas (IPN-CICIMAR). VHCE, LAAC, AFGA thanks, IPN-EDI, IPN-COFAA. VHCE, MVMZ, LAAC, AFGA thanks, Sistema Nacional de Investigadores (CONACyT-SNI). JFL thanks División de Investigación de la Facultad de Estudios Superiores Iztacala de la Universidad Nacional Autónoma de México. EME thanks the National Council of Science and Technology (CONACYT) for support though the program “Cátedras". UNAM partially funded this research (Project: Aspectos Biológicos y ecológicos de los sistemas costeros del estado de Veracruz). We want to thank for the comments and suggestions made by two anonymous reviewers, whereby substantially enriched the manuscript.